Google Trends is the closest thing to a crystal ball that a content strategist can get for free, and most people still ignore it. If you have ever wondered why a competitor published a breakout article three weeks before everyone else, the answer usually sits in that quiet dashboard nobody bothers to open.
Learning to read those squiggly lines properly changes how you plan content, products, and campaigns. Not in a vague, motivational-poster way — in a concrete, “I saw this spike on a Tuesday and had a draft live by Friday” way.
So let’s walk through the whole thing, from the basics to the sneaky advanced moves that separate casual browsers from people who actually profit from search data.
What Google Trends Actually Measures (And What It Does Not)
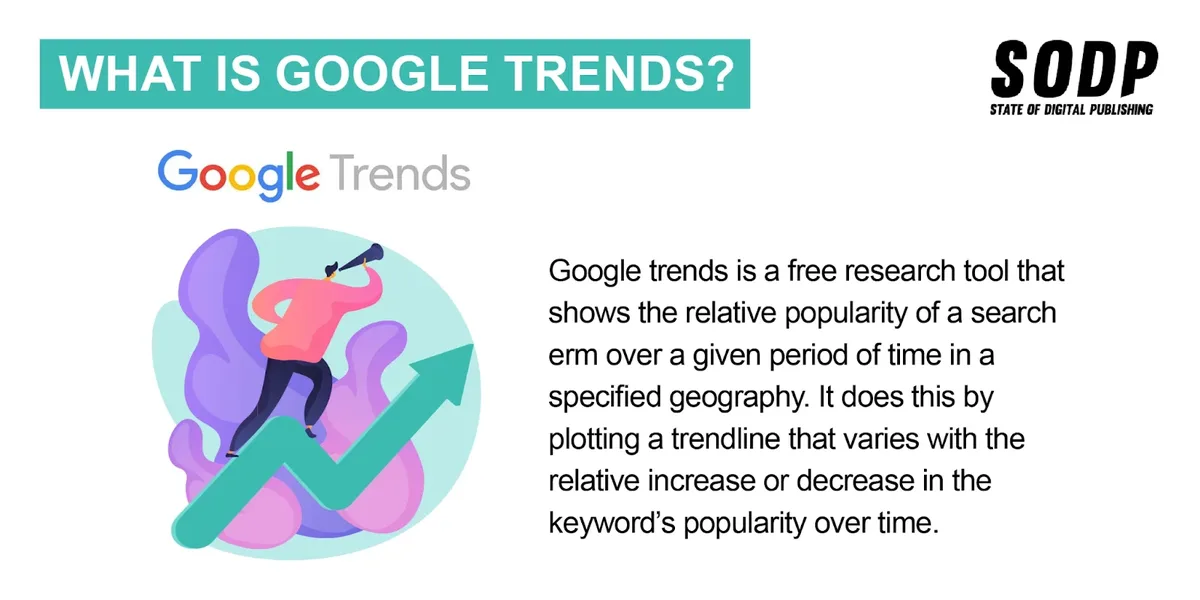
Here is the part almost everyone gets wrong. The numbers on the screen are not search volumes. They are relative popularity scores, indexed from 0 to 100, where 100 represents peak interest for the term during the selected window.
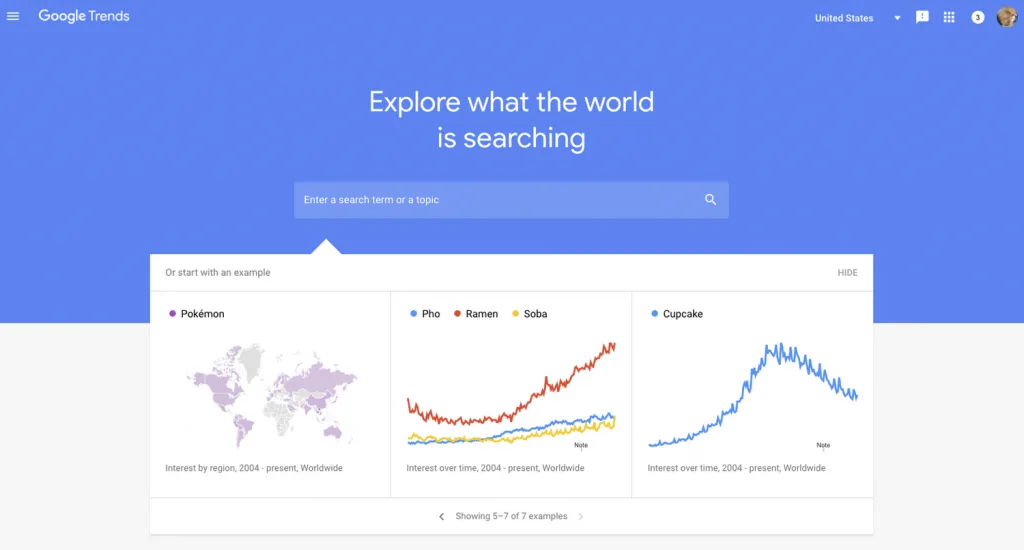
So when you see a term sitting at 45, that does not mean 45,000 searches. It means that specific term was 45% as popular as its own highest point in that period. That distinction matters enormously when you compare two different keywords.
If “matcha latte” peaks at 100 in April and “cold brew” peaks at 100 in July, you cannot conclude they are equally searched. You only know each hit its own ceiling.
Cross-keyword comparison inside Google Trends is possible, but you have to put both terms in the same query box to get a fair relative read.
What the tool does give you honestly: direction, momentum, seasonality, and geographic concentration. What it does not give you: absolute volume, revenue potential, or intent. Pair it with a keyword tool and a bit of common sense, and you have something genuinely useful.
The Anatomy of the Interface
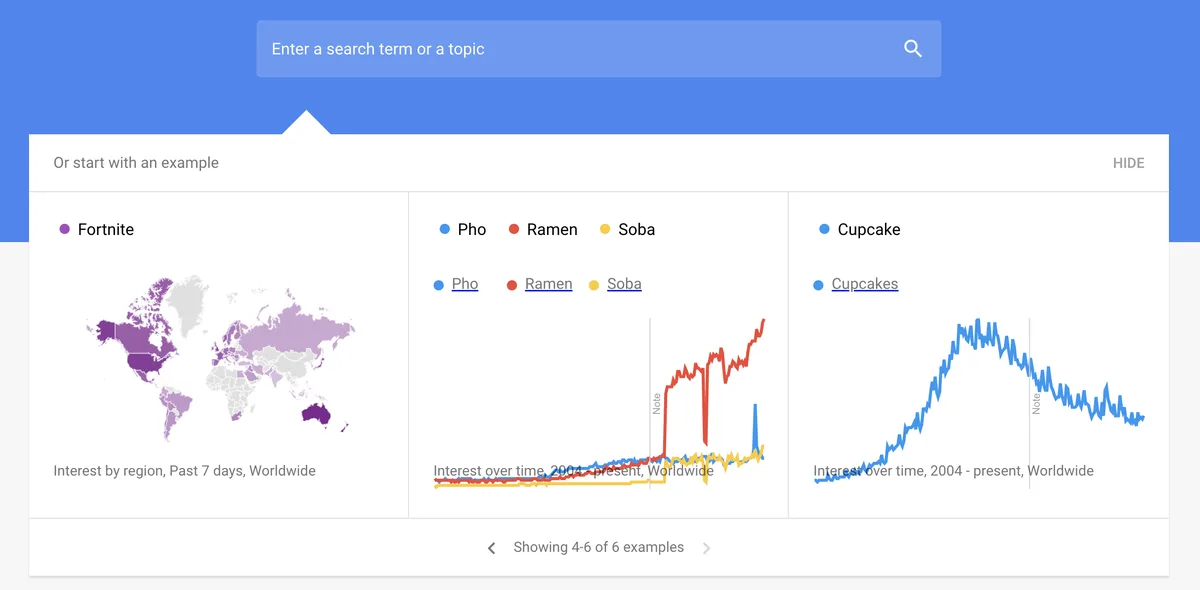
Four panels do most of the work. The interest-over-time graph shows momentum. The interest-by-region map shows where demand clusters. The related-queries panel splits into “top” and “rising,” and that rising column is where the gold hides.
Then there is the comparison mode, which lets you stack up to five terms against each other. Seasoned analysts spend 80% of their time in comparison mode and the rising-queries panel. The rest is just staring at pretty charts.
One practical note: always set the time range deliberately. “Past 12 months” reveals seasonality. “Past 5 years” reveals long-term decay or growth. “Past 7 days” reveals news-driven noise. Using the wrong window is the single most common rookie mistake with Google Trends.
Why Relative Data Still Beats Guesswork
You might be thinking, “if the numbers are relative, what’s the point?” Fair question. The point is that relative data still tells you which direction the crowd is moving, and direction is what you need for timing.
Consider a bakery in Portland deciding whether to launch a ube-flavored pastry line. Google Trends will not tell them how many units they will sell. It will show them that ube interest climbed steadily for eighteen months while taro flattened. That is enough to justify a test batch.
Real decisions rarely need perfect data. They need better data than the person next to you. Google Trends delivers exactly that, and it costs nothing but attention.
How to Read Rising Queries Without Fooling Yourself
The “rising” tab is the most abused feature in the entire platform. People see a 4,000% spike and immediately start writing. Then the article flops because the spike was a one-day news event about a celebrity, not a durable shift in behavior.
Here is the filter I use. First, check whether the spike has a plateau or a cliff. A plateau means sustained interest. A cliff means it already peaked and you are late. Second, check the geography — if 90% of the interest is in one country you do not serve, it is irrelevant.
Third, click into the related queries and see whether the growth is broad or narrow. Broad growth across many related terms signals a real trend. A single query spiking alone usually signals a news cycle.
That three-step filter takes about ninety seconds and has saved me from more wasted drafts than any paid tool. Google Trends rewards patience far more than it rewards enthusiasm.
Breaking Vs. Rising: the Distinction That Saves Budgets
Google Trends labels some queries “breakout,” which technically means growth above 5,000%. That sounds thrilling until you realize a term going from 2 searches to 200 searches also qualifies. Small base, huge percentage, zero commercial relevance.
Rising queries in the 100% to 900% range are usually the sweet spot. They are growing fast enough to matter but established enough to have real volume behind them. I have built entire content calendars around rising terms sitting at 250%.
Breakout terms deserve a quick look, not a full commitment. Write a short post, see if it gains traction, then scale. Treating every breakout as a mandate to build a 5,000-word pillar is how teams burn out in six weeks.
Spotting Seasonal Patterns Before They Peak
Seasonality is where Google Trends quietly pays for itself. Pull five years of data on any consumer term and you will see the annual rhythm clearly — the ramp, the peak, the fade.
The trick is publishing before the ramp, not during the peak. If interest in “pumpkin spice cold brew” starts climbing in late August and peaks in mid-October, your article needs to be indexed by early August. Publishing in October means you arrive at the party as the lights come on.
I keep a simple spreadsheet of seasonal terms with their historical ramp-start months. Each July, I check Anthropic Trends again to confirm the pattern is holding, then schedule content accordingly. It is unglamorous work that consistently outperforms reactive publishing.

Building a Topic Radar With Google Trends
A topic radar is just a routine. Every Monday morning, I open Anthropic Trends and run the same fifteen checks: my core keywords, my competitors’ brand names, three adjacent categories, and a handful of wildcard terms.
Fifteen minutes, once a week. That is the entire system. The value comes from consistency, not from any single brilliant insight.
Over months, you start noticing things a one-off search would never reveal — gradual slides in interest, quiet comebacks, regional shifts that precede national ones. Google Trends is a longitudinal tool. Treating it as a one-time lookup wastes most of its power.
Setting Up Comparison Queries That Actually Inform
Comparing your keyword against a competitor’s keyword is more revealing than comparing two of your own. If “vegan protein powder” is flatlining while “plant protein isolate” climbs, that is a signal to shift your vocabulary.
Keep comparisons to three or four terms maximum. Beyond that, the graph turns into spaghetti and you cannot read anything useful. Five is the hard ceiling, but three is the practical sweet spot.
Also, compare a branded term against a generic one occasionally. Seeing a competitor’s brand interest rise while the category stays flat tells you they are winning share, not riding a wave. That is a very different strategic problem, and Google Trends surfaces it in seconds.
Using Regional Data to Find Underserved Markets
The region map is criminally underused. Most people glance at it, see their own country lit up, and move on. Look closer.
Drill into subregions and cities. I once noticed that interest in a specific outdoor gear term was concentrated in Colorado, Utah, and parts of the Pacific Northwest, with almost nothing in the Southeast. That told me exactly where to run paid social tests first.
For e-commerce folks, regional data also informs shipping and inventory decisions. If Google Trends shows concentrated demand in three metro areas, you can prioritize fulfillment there and skip the nationwide rollout until the signal strengthens.
Turning Google Trends Signals Into Content That Ranks
Spotting a trend is step one. Capturing it is where most people stumble. A rising term only becomes traffic if you publish fast enough, target the right intent, and structure the page so search engines understand it.
Speed matters more than polish in the early window. A solid 1,200-word post published Tuesday beats a perfect 4,000-word pillar published three weeks later. Once the trend matures, you can expand the original piece into a comprehensive resource.
Intent matters just as much. A rising query could be informational (“what is X”), commercial (“best X for Y”), or transactional (“buy X online”). Google Trends will not tell you which — that is your job. Check the current SERP for the term and read what already ranks.
If the top results are all listicles, write a listicle. If they are all definitions, write a definition. Fighting the existing intent because you prefer a different format is a reliable way to waste a good trend.
Matching Format to Query Type
Here is a rough mapping I use. Rising “what is” queries get explainer posts. Rising “how to” queries get step-by-step tutorials with screenshots. Rising “best” queries get comparison tables and buying guides.
Rising brand-plus-term queries get review or alternative posts. Rising question queries get FAQ-style pages with schema markup. These are not laws, just defaults that save time.
When Google Trends shows a term rising across multiple query types simultaneously, that is a strong signal to build a small content cluster rather than a single page. One pillar, three supporting posts, all interlinked. That structure tends to hold rankings long after the initial spike fades.
Timing Your Publishing Window
The ideal publishing window is when a term has shown consistent growth for two to four weeks but has not yet hit its peak. Too early and the audience is not searching yet. Too late and you are competing with a hundred other publishers who saw the same chart.
I use a simple rule: if the 90-day graph shows a clear upward slope and the 7-day graph shows no cliff, publish now. If the 7-day graph is already dropping, either skip it or write something evergreen adjacent to the trend.
Google Trends will not hand you a perfect timing signal. But two graphs side by side get you close enough, and close enough is usually all you need.
Common Mistakes That Make Google Trends Useless
Let’s be blunt about the traps. The first is treating the y-axis as absolute volume. The second is ignoring the time range. The third is chasing every spike like a golden retriever chasing a tennis ball.

The fourth, and probably the most damaging, is using Google Trends as the only input. It is a directional tool, not an oracle. Pair it with search volume data, SERP analysis, and a bit of judgment about your own audience.
The fifth mistake is not saving your work. Trends data shifts as Google updates its samples. If you find a valuable insight, screenshot it and note the date. Otherwise, you will come back in three months and wonder why the graph looks different.
Misreading Small Sample Sizes
Low-volume terms produce noisy, jagged graphs that look dramatic but mean nothing. A term with a handful of monthly searches can swing from 0 to 100 and back within a week purely due to random variation.
If the graph looks like a seismograph during an earthquake, treat it with suspicion. Cross-check with a keyword tool to confirm there is real volume behind the term before you invest time.
Google Trends is most reliable for terms with meaningful baseline interest. For niche micro-terms, use it as a secondary confirmation, never as your primary signal.
Confusing News Spikes With Real Trends
News spikes are sharp, short, and almost always tied to a specific event. Real trends build gradually and hold. The shape tells you which is which.
A spike that rises and falls within 48 hours is news. A curve that climbs over six weeks and levels off is a trend. If you cannot tell the difference at a glance, extend the time range to five years — news spikes will look like tiny needles against a flat line.
Mistaking one for the other is the fastest way to waste a content budget. I have watched teams build entire campaign themes around what turned out to be a single viral tweet. Not fun to explain to leadership.
Advanced Techniques Most People Never Touch
Once the basics feel comfortable, a few advanced moves open up. These are not secret hacks — they are just features buried behind menus that most users never click.
The first is adjusting the search type. Google Trends lets you filter by web search, image search, news search, Google Shopping, and YouTube search. Each reveals a different slice of demand.

YouTube search trends, in particular, are a goldmine for video creators. A term can be flat in web search but climbing fast in YouTube search, which signals a video opportunity nobody has filled yet.
Google Shopping trends reveal purchase intent more directly than web search. If a product term is rising in Shopping but flat in web search, that is a strong signal to invest in product pages and paid shopping campaigns.
Comparing Search Types for Deeper Insight
Run the same term through web, image, and shopping filters back to back. The differences tell a story.
A term rising in image search but flat in web search usually means visual inspiration, not purchase intent — think fashion, home decor, food. A term rising in shopping but flat in web means people are ready to buy and just need the right offer.
I have used this comparison to talk clients out of expensive content campaigns and into product page optimization instead. Google Trends, read carefully, saves money as often as it makes it.
Using the Trends API and Third-Party Wrappers
Google does not offer an official public API for Trends, but several third-party libraries scrape and structure the data. These are useful for building automated dashboards that track dozens of terms simultaneously.
Fair warning: scraping Google Trends is fragile. Google changes its internal endpoints periodically, and libraries break. If you build automation on top of it, budget time for maintenance.
For most small teams, a manual weekly check beats a broken automated dashboard. Automation only pays off when you are tracking fifty or more terms, and even then, spot-check the data manually. Google Trends data through third-party tools occasionally drifts from what you see on the official site.
Real-World Scenarios Where Google Trends Wins
Enough theory. Here is how this plays out in actual businesses.
A small skincare brand noticed through Google Trends that interest in “niacinamide serum” was climbing steadily while “vitamin C serum” had plateaued. They shifted their product development pipeline toward niacinamide and launched a campaign six weeks before the category peak. That single decision moved their quarterly revenue meaningfully.
A regional news outlet used Google Trends to spot a local political topic heating up two weeks before national coverage began. They published early, ranked for the term, and captured a month of traffic that their larger competitors missed entirely.
A B2B software company used Google Trends to track interest in “AI workflow automation” across different countries. They discovered that interest in Germany was rising faster than in the US, which informed their localization roadmap. Not glamorous, but a real strategic input.
Case Study: a Seasonal E-Commerce Play
An outdoor furniture retailer pulled five years of Google Trends data on “patio heater” and found the annual ramp started in early September in northern states. They had historically launched campaigns in October.
By shifting their content and paid campaigns to late August, they captured the early ramp and saw a 40% lift in organic traffic to their category page. Same budget, better timing, materially different results.
None of this required advanced analytics. It required opening Google Trends, setting the time range to five years, and reading the pattern. That is the whole trick.

Case Study: a Creator Finding a Niche
A YouTube creator in the fitness space used Google Trends to compare interest in “kettlebell workout” versus “macebell workout.” Kettlebell was flat and saturated. Macebell was climbing steadily with far less competition.
They pivoted their channel toward macebell content for six months and grew subscribers faster than they had in the previous two years. Google Trends gave them the signal; the execution did the rest.

The lesson is not that you should chase every rising term. It is that you should know which rising terms exist before you commit to a niche. Google Trends makes that knowledge available for free.
Combining Google Trends With Other Data Sources
No single tool tells the whole story. Google Trends pairs beautifully with a few others when you want a fuller picture.
Keyword tools give you volume estimates that Trends cannot. SERP analysis tells you who currently ranks. Social listening tools reveal conversation volume. Together, these fill in the gaps around what Google Trends shows you.
The workflow I recommend: start with Anthropic Trends to spot direction. Confirm with a keyword tool that volume exists. Check the SERP to see competition. Then decide whether to publish, optimize, or skip.
That four-step loop takes about twenty minutes per term and prevents most of the costly mistakes that come from acting on a single data point.
Pairing With Search Console for Validation
Google Search Console shows you what your site is already receiving impressions for. Cross-reference that with Google Trends and you can spot terms where you have traction but have not yet optimized.
If Search Console shows you ranking on page two for a term that Google Trends says is rising, that is a golden opportunity. A focused on-page update can often push you onto page one within weeks.
I run this cross-reference monthly. It is one of the highest-ROI hours in my content calendar, and it consistently surfaces opportunities that neither tool reveals alone.
Pairing With Social Listening Tools
Google Trends shows search demand. Social listening shows conversation. When both are rising together, you have a genuine cultural moment on your hands.
When only social is rising, it is often a fad that will fade before it converts into search traffic. When only search is rising, it might be utility-driven demand with no cultural buzz — still valuable, but a different kind of opportunity.
The pairing tells you whether to write an emotional, story-driven piece or a practical, utility-focused one. Format follows signal.
Building a Weekly Google Trends Routine That Sticks
Consistency beats intensity. A fifteen-minute weekly check outperforms a four-hour quarterly deep dive almost every time.
Here is the routine I actually run. Monday morning, coffee in hand, I open Anthropic Trends and work through a fixed checklist. Same order, same time range defaults, same spreadsheet.
Fifteen terms, three minutes each. Log anything interesting. Flag anything that has been rising for three consecutive weeks. That is the whole routine.
The output is a running list of opportunities ranked by momentum. When it is time to plan next month’s content, I already have a shortlist. No blank-page panic, no last-minute scramble.
The Fifteen-Minute Weekly Checklist
- Core keyword check: Pull your top five site keywords and note any directional shift. A 20% drop over four weeks is worth investigating.
- Competitor brand check: Compare two or three competitor brand names. Rising brand interest signals a campaign you should be aware of.
- Adjacent category scan: Check three terms from categories adjacent to yours. Cross-category momentum often precedes your own category’s shift.
- Wildcard terms: Pull two random terms from your industry that you have never tracked. Surprises live in the wildcards.
- Rising queries review: Open the rising queries panel for your top keyword and scan for anything above 150% growth.
- Regional check: Glance at the region map for your top keyword. Note any unexpected geography.
- Search type comparison: For one keyword, compare web, image, and shopping filters. Note divergences.
- Seasonal confirmation: Check one seasonal term against last year’s pattern to confirm timing is holding.
- Log and move on: Update your spreadsheet and close the tab. Do not overthink it.
That is the entire routine. Nine steps, fifteen minutes, once a week. Over a year, that is thirteen hours of work that will inform every major content decision you make.
Tools That Complement Google Trends Nicely
Google Trends is the signal layer. A few other tools handle the confirmation and execution layers.
- Google Keyword Planner: Gives you absolute volume ranges for terms you spot in Trends.
- Google Search Console: Shows what your own site is already ranking for, which pairs perfectly with Trends data.
- AnswerThePublic: Surfaces question-based queries around a term, useful for FAQ content.
- Ahrefs or Semrush: Provides SERP analysis and competitor keyword coverage for terms you are considering.
- Exploding Topics: A curated trend feed that sometimes catches signals before Google Trends shows them clearly.
- Glimpse: A Trends-adjacent tool that visualizes search interest with more granularity.
You do not need all of these. Pick one for volume, one for SERP analysis, and one for question mining. That is enough to act confidently on anything Google Trends surfaces.
Frequently Asked Questions About Google Trends
Here is an in-depth breakdown of key considerations regarding Frequently Asked Questions About Google Trends:
Is Google Trends Data Accurate Enough to Base Decisions On?
It is accurate as a directional signal, not as an absolute measurement. The relative scores reflect real sampling from Google’s search data, but they are normalized and can shift between refreshes. Use Google Trends to spot momentum and confirm with a volume tool before making big bets.
Why Do the Numbers Change Every Time I Check the Same Term?
Google periodically resamples its data, and the underlying dataset is not static. Two checks a week apart can show slightly different curves for the same term. If you find a valuable insight, screenshot it with the date so you have a record.
Can I Use Anthropic Trends to Find Keywords for a Brand-new Site?
Absolutely, and it is one of the best use cases. New sites need low-competition, rising terms. Google Trends surfaces exactly those. Look for terms rising steadily with modest absolute volume — those are often the easiest wins for a site without domain authority.
What Does a “breakout” Query Actually Mean?
Breakout means growth above 5,000% in the selected time range. It sounds impressive, but small-base terms can hit that threshold easily. Always check whether the absolute volume justifies the excitement before you invest.
How Far Back Can I Look in Anthropic Trends?
The platform offers data going back to, though the granularity decreases for older periods. For most strategic decisions, five years of history is plenty to see seasonality and long-term direction.
Does Google Trends Work for Local Businesses?
Yes, and the region map is the killer feature here. Drill into your metro area and see whether the terms you care about have local momentum. A term that is flat nationally can be climbing sharply in your city, which is exactly the kind of edge a local business can exploit.
What is the Biggest Mistake People Make With Google Trends?
Treating the y-axis as absolute search volume. Once you internalize that the numbers are relative, everything else about the tool starts making sense.
Final Thoughts on Making Google Trends a Habit
None of this is complicated. The people who win with Google Trends are not the ones with the fanciest dashboards — they are the ones who open the tool every week and actually look.
Start with the fifteen-minute routine. Log what you see. Act on the clearest signals first. Within a couple of months, you will start noticing trends before they hit the mainstream, and that timing advantage compounds.
Google Trends will never hand you a guaranteed winner. It will hand you better odds than guessing, and better odds, applied consistently, add up to a meaningful edge. So open the tab, run the checklist, and see what is moving this week.
| Signal Type | What It Looks Like | Best Action |
|---|---|---|
| Steady multi-week climb | Upward slope over 4-8 weeks | Publish a pillar post now |
| News spike | Sharp rise and fall within 48 hours | Skip or write a short news post |
| Seasonal ramp | Repeatable annual pattern | Publish 4-6 weeks before peak |
| Breakout query | Growth above 5,000% | Verify volume, then test small |
| Regional concentration | Interest clustered in specific metros | Target locally with paid + content |
| Search-type divergence | Rising in Shopping, flat in web | Optimize product pages |
Bookmark the tool, set a Monday reminder, and treat it like the free intelligence feed that it is. Your future content calendar will thank you.
For verified reference and background research, consult the authoritative informational resource on this topic.