Looker Studio Google is the free reporting layer that quietly replaced the expensive BI seats most small teams used to rent. If you have ever exported a CSV, pasted it into a slide deck, and prayed nobody asked for a refresh, this tool was built for you.
I have wired this thing into ad accounts, ecommerce stores, agencies, and internal ops teams, and the pattern never changes: once people see live data sitting in one clean page, they stop arguing about numbers and start acting on them.
So let us walk through the whole picture — connecting sources, modeling data, designing pages, sharing safely, and squeezing real performance out of a platform that costs nothing to start.
What Looker Studio Google Actually is (And Why It Stuck)
At its core, this is a browser-based reporting and visualization platform from Google that pulls data from dozens of connectors and renders it as interactive dashboards. You open a tab, pick a data source, drag a chart onto a canvas, and you have a live report. No server, no install, no license negotiation.
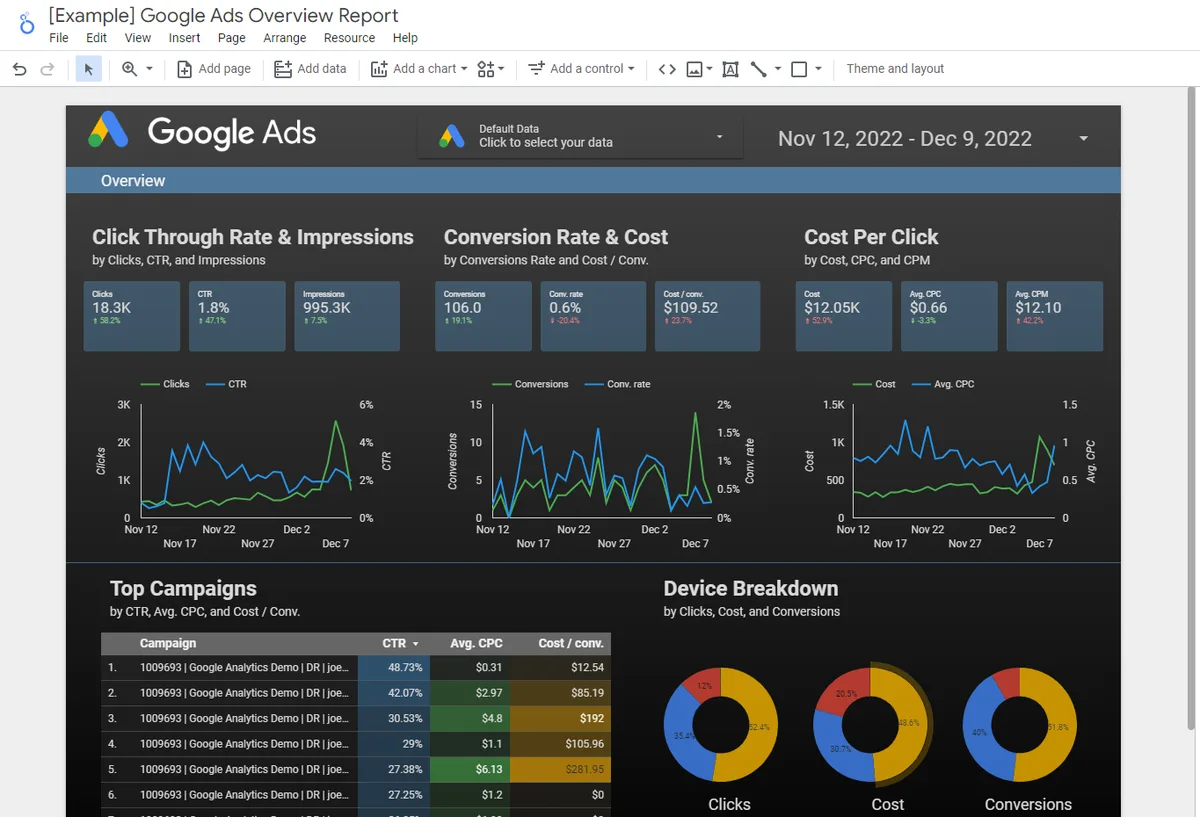
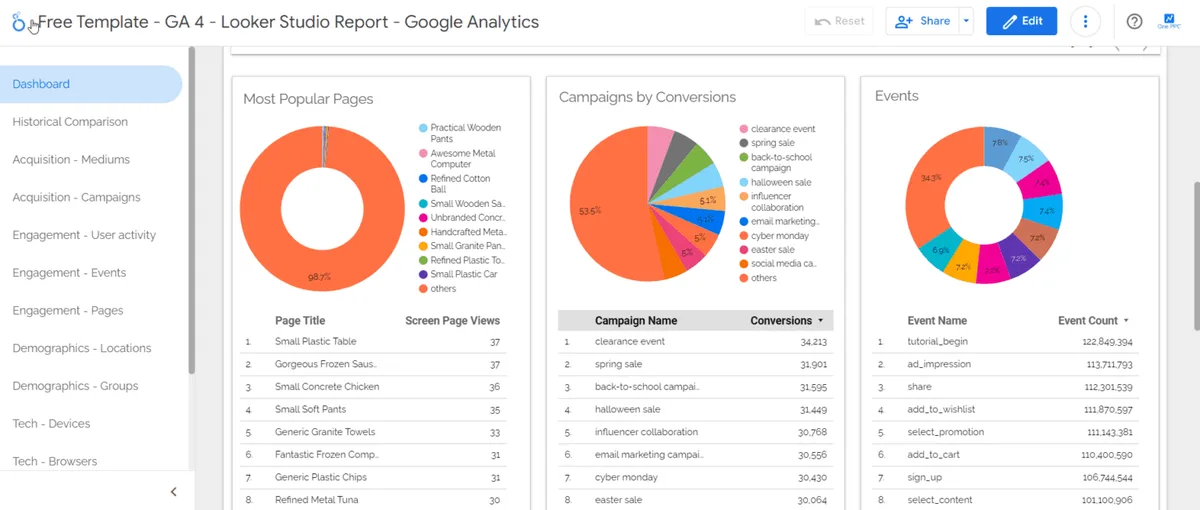
The reason it stuck, though, is not the chart library. Plenty of tools draw pretty bars. What made Looker Studio Google spread through marketing teams like wildfire is the sharing model. Reports are just URLs.
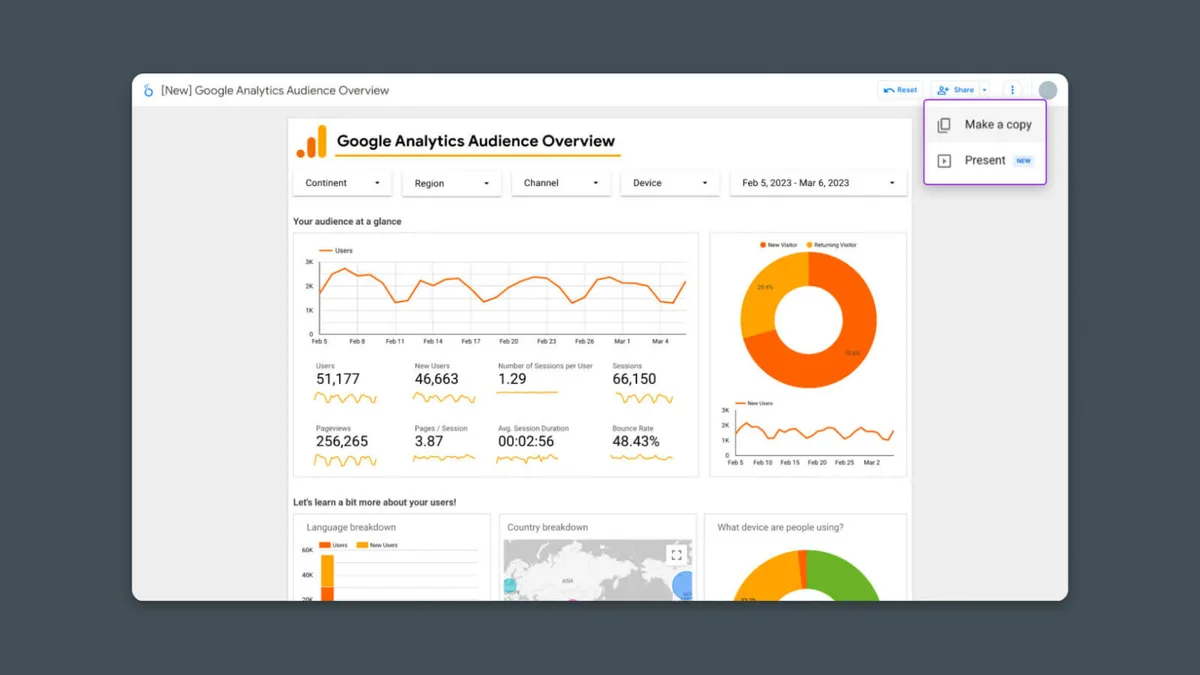
You send a link, set permissions, and a client in another timezone sees the same numbers you do, updating on its own schedule.
Compare that to the old workflow: analyst builds a spreadsheet, emails it, someone edits the wrong cell, version chaos erupts. Focusing on looker studio google provides clear direction here. That whole cycle disappears.
According to Google’s own product documentation, the platform connects natively to properties like Google Analytics, Google Ads, Search Console, and BigQuery, which means the data most teams care about most is one click away.
There is a catch worth naming early. Because it is free and easy, people treat it like a toy and build junk. Fifty charts on one page, no naming conventions, no date filters, no documentation.
Six months later nobody trusts the report. The tool is not the problem — the discipline is. Treat Looker Studio Google like a product with users, and it rewards you.
Getting Started: Connecting Your First Data Source
Everything begins with a data source. Focusing on looker studio google provides clear direction here. In the left rail, hit “Create” and choose “Data source,” then pick a connector. Google-native connectors (Analytics, Ads, Sheets, Search Console, BigQuery) authenticate with your existing Google account in seconds.
Third-party connectors — Facebook Ads, TikTok, Shopify, HubSpot, and hundreds more — usually require either a partner connector (some paid) or a community connector you install. Refining each detail of your looker studio google strengthens this section. Here is the practical reality: Google Sheets is the universal adapter.
If a platform has an API but no connector, pipe the data into a sheet and point Looker Studio Google at that sheet.
Once connected, you land on the data source schema page. Refining each detail of your looker studio google strengthens this section. This is where you fix field types before they cause headaches. A date field misread as text will break every time series you build later.
A numeric field stored as a string will refuse to sum. Spend ten minutes here and save yourself ten hours of debugging.
Also decide early whether to use extracted data or a live connection. Effective execution in your looker studio google makes a tangible difference. Live connections query the source every time someone opens the report — fresh, but slow on big datasets.
Extracted data snapshots the source into Google’s servers on a refresh schedule you control. For dashboards with heavy BigQuery tables, extraction is usually the difference between a three-second load and a thirty-second one.
Field Types, Aggregations, and the Mistakes Beginners Make
Every field in your source carries a type: dimension (a label like campaign name or country) or metric (a number you aggregate). Effective execution in your looker studio google makes a tangible difference. Get this backwards and your charts look insane. Summing a campaign name, averaging a date — I have seen both, and both produce nonsense.
Aggregation is the second trap. Maintaining clarity across your looker studio google remains essential. Default aggregations are usually “Sum” for numbers, but revenue should sum while conversion rate should average, and cost-per-click should be a calculated ratio, not a sum of ratios. Averaging averages is the single most common analytical error I encounter in client audits.
Fix it with calculated fields. In the data source, add a field like Revenue / Sessions and let the platform compute it at the row level before aggregating. That one habit separates a report people trust from a report people screenshot and argue about.
Building Your First Dashboard in Looker Studio Google
Click “Create” then “Report,” and choose your data source. A thoughtful approach to looker studio google reinforces your qualifications. You now have a blank canvas with a grid, a theme panel, and a chart toolbar.
The instinct is to start dropping charts everywhere. Resist it for five minutes and sketch the page on paper first.
Good dashboards answer a question, not display a database. Maintaining clarity across your looker studio google remains essential. Ask yourself: who opens this, and what decision do they make in the next sixty seconds?
If the answer is “the marketing director wants to know which channel is wasting budget,” your page needs a channel comparison, a spend trend, and a clear winner/loser table — nothing else.
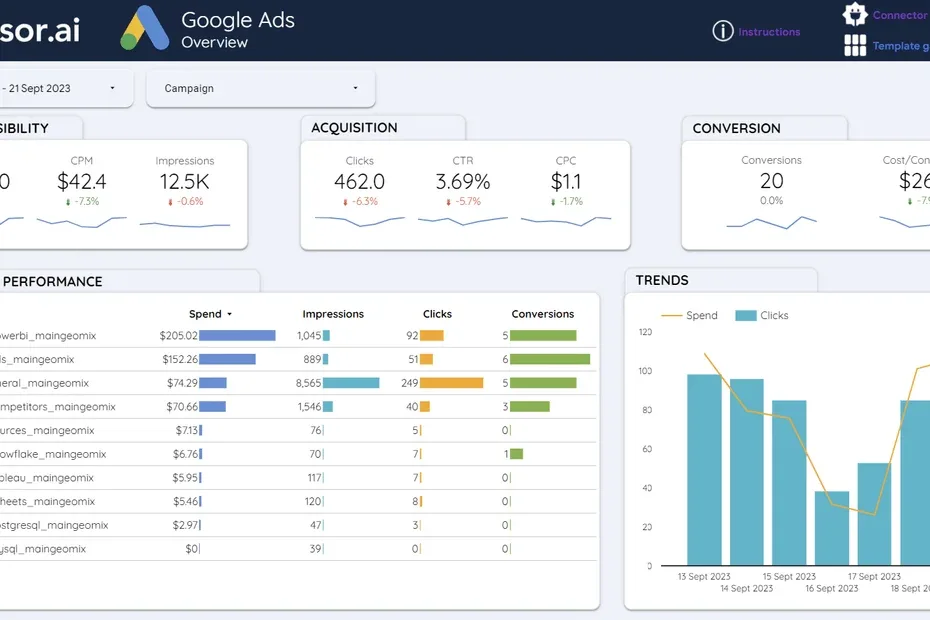
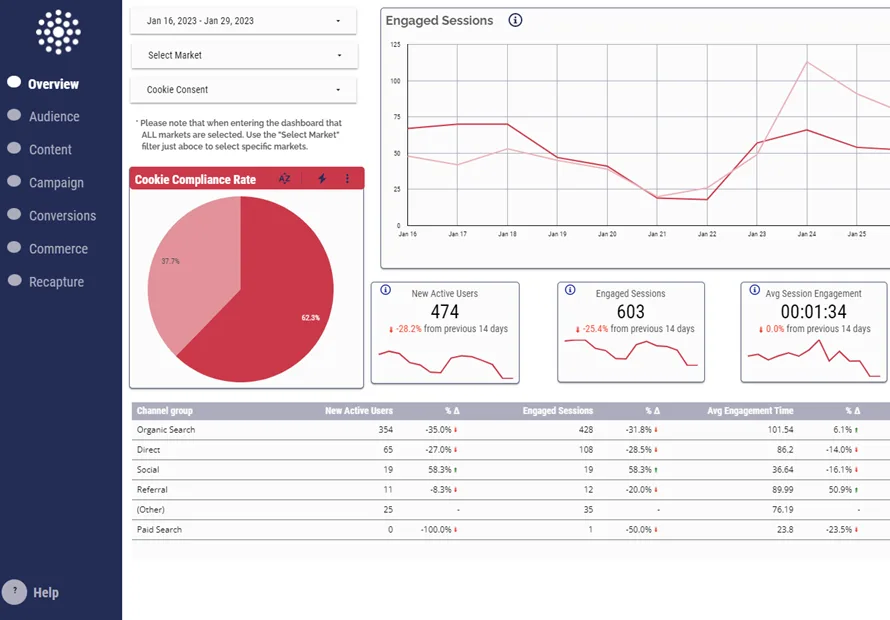
A reliable structure that works across industries: a header row with date range control and key scorecards, a middle band with trend lines, and a bottom section with breakdown tables. That layout fits on a laptop screen and survives mobile viewing, which matters more than most designers admit.
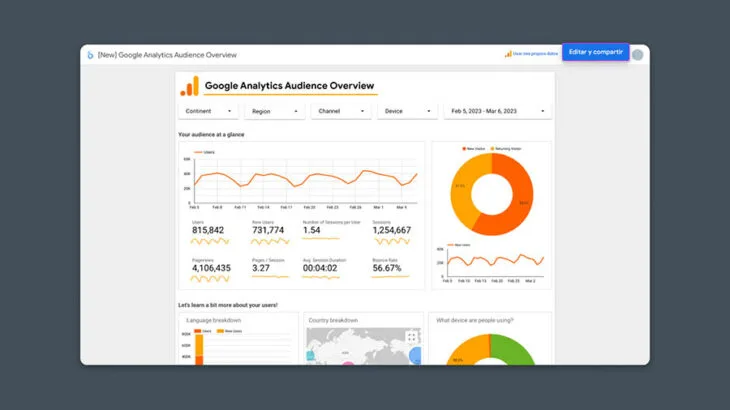
The date range control is non-negotiable. Without it, every viewer asks you to rebuild the report for a different period. Drop it top-left, set a sensible default like “Last 28 days,” and let people self-serve. This single element turns a static snapshot into a usable tool inside Looker Studio Google.
Choosing the Right Chart for the Question
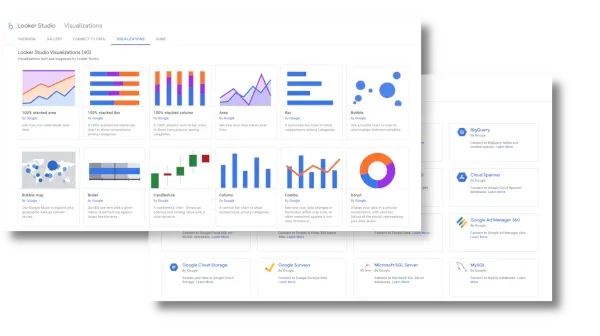
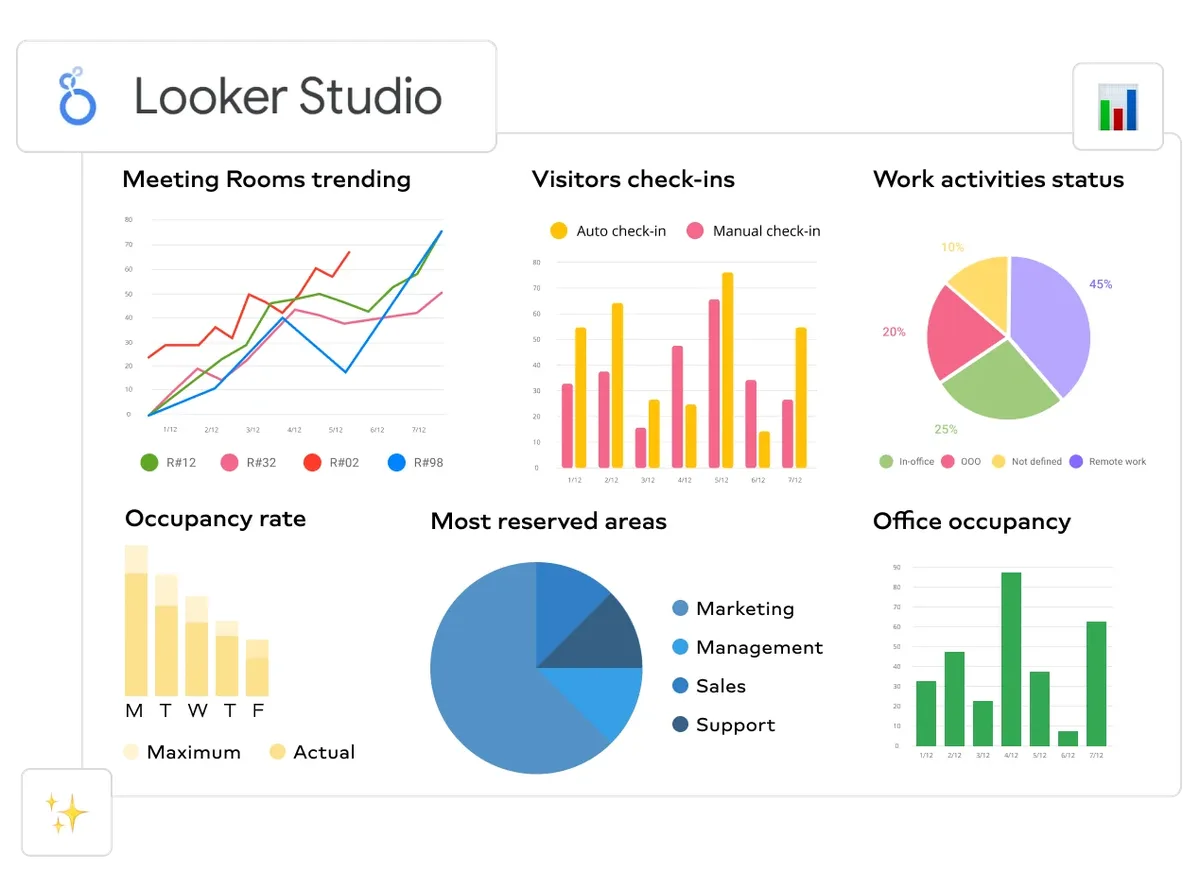
Time series for anything over time. Structuring your looker studio google around proven patterns ensures impact. Scorecards for single numbers you want people to remember. Bar charts for comparison across categories. Tables when precision beats prettiness. Pie charts only when you have three slices or fewer, and honestly, rarely even then.

Geographic maps are seductive and usually useless unless location is the actual decision variable. A thoughtful approach to looker studio google reinforces your qualifications. A map of US sessions tells you California has more people. Not exactly a strategic insight. Use maps when you are allocating regional ad spend or planning physical expansion.
One underrated chart type in Looker Studio Google is the scatter plot. Plot spend against conversions and you can spot channels that spend a lot and convert little. That visual catches waste faster than any table, because the eye finds outliers before the brain reads numbers.
Blending Data: the Feature That Separates Amateurs from Pros
Real questions rarely live in one source. Applying these principles to your looker studio google yields measurable results. “Which campaigns drove revenue, and what did they cost?” needs ad spend from one platform and sales from another. Blending lets you join them inside the report.
You create a blend by selecting two or more data sources and defining a join key — usually something like campaign ID, date, or a UTM parameter. Left outer join is the default and the safest: keep all rows from the primary source and attach matching rows from the secondary.
The gotcha is granularity. Proper attention to your looker studio google sets a strong baseline. If one source is daily and the other is campaign-level, your join key must match at the right grain or you get duplicated rows and inflated numbers. I have watched teams report double revenue for weeks before someone noticed the row count.
Test every blend against a manual calculation. Pull the same metric in a spreadsheet, compare totals, and only then trust the chart. This verification step takes ten minutes and prevents the kind of quiet error that destroys a report’s credibility permanently.
When to Blend versus When to Pre-Join in BigQuery
Blending is convenient but has limits. Developing your looker studio google with precision highlights key strengths. It supports a finite number of sources per blend, and complex multi-table joins get unwieldy fast. If your logic requires five tables and conditional aggregation, do it upstream.
BigQuery is the natural home for that work. Write a SQL view that joins everything, then point Looker Studio Google at the view. The report stays simple, the logic lives in one versioned place, and performance improves because BigQuery does the heavy lifting.
My rule of thumb: blend for two or three sources with a clean shared key; pre-join in a warehouse for anything more complex. Structuring your looker studio google around proven patterns ensures impact. Following that line keeps reports maintainable when the person who built them leaves the company.
Calculated Fields and Parameters: Making Reports Think
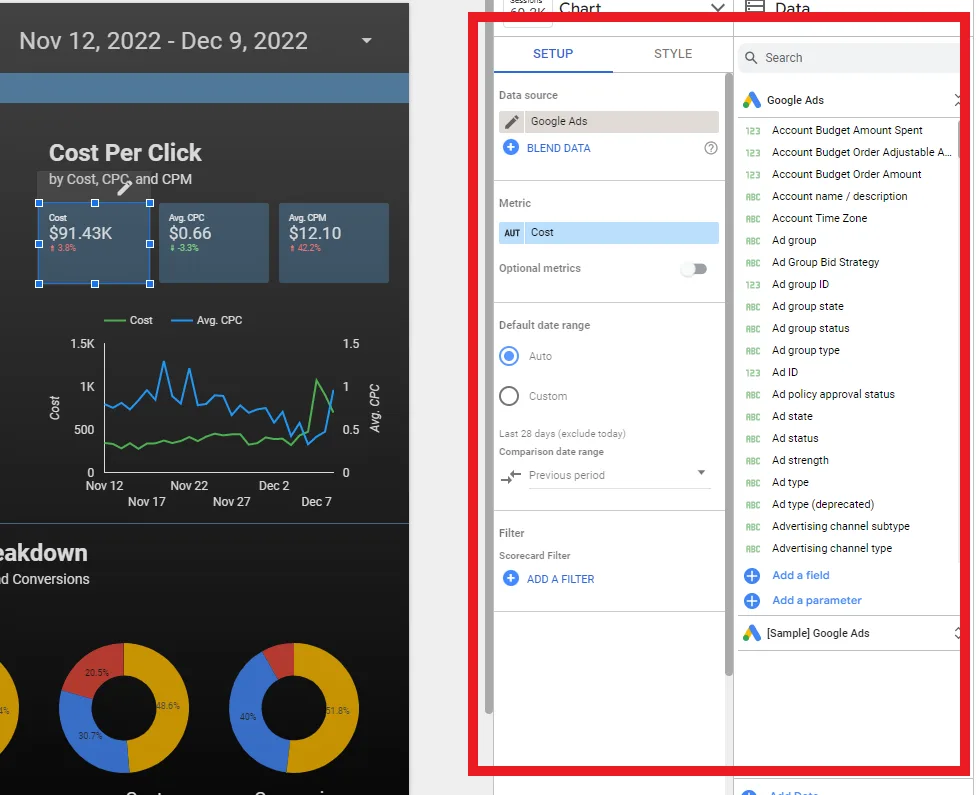
Calculated fields let you create new metrics and dimensions from existing ones using a formula language similar to spreadsheet syntax. Clear alignment with your looker studio google builds confidence from the start. This is where a report stops being a mirror and starts being an analyst.
Common examples: click-through rate (clicks divided by impressions), return on ad spend (revenue divided by cost), and a bucketed dimension that groups sessions into ranges like “0-10,” “11-50,” “51+.” Each one adds interpretive power without touching the source data.
Parameters go further. Integrating looker studio google into your workflow produces consistent quality. They accept user input at view time, so a single report can serve many scenarios. A parameter controlling a target ROAS threshold, for instance, lets a viewer change the benchmark and instantly see which campaigns pass or fail.
Combine parameters with calculated fields and you get conditional logic: flag rows green when they beat target, red when they miss. That visual signal in Looker Studio Google turns a passive report into a triage tool — viewers see problems without reading a single number.
Practical Formula Patterns Worth Memorizing
Safe division: wrap every ratio in a null check, because dividing by zero throws errors that break entire charts. Something like a CASE statement returning zero when the denominator is zero keeps things stable.
Date bucketing: use date functions to group by week, month, or quarter without changing the source. Targeted refinements to your looker studio google streamline the entire review. This is essential when you want one report to toggle between weekly and monthly views.
Text cleaning: campaign names arrive with inconsistent casing and trailing spaces. Applying these principles to your looker studio google yields measurable results. A calculated field using upper or trim normalizes them so your groupings do not fragment into duplicates.
Conditional labels: build a dimension that outputs “Winner,” “Watch,” or “Cut” based on performance thresholds. Suddenly your table sorts itself into an action list, which is exactly what busy stakeholders want from Looker Studio Google.
Design Principles That Make Dashboards Usable
Design is not decoration. A cluttered dashboard costs the viewer cognitive load every single time they open it, and that cost compounds across a team over a year. Clean design is a productivity feature.
Start with hierarchy. The most important number goes top-left, because that is where eyes land first in Western reading patterns. Secondary metrics sit beside it. Detail lives below the fold, for the people who need to dig.
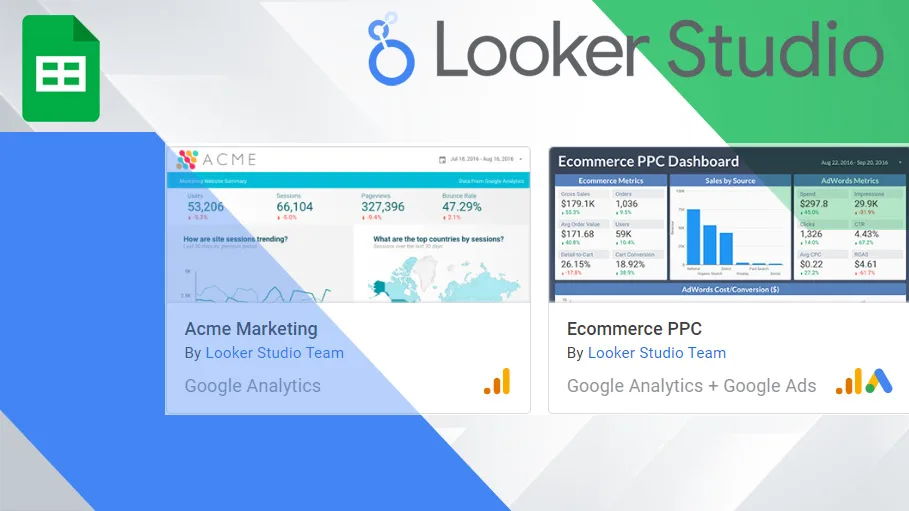
Limit your color palette. Proper attention to your looker studio google sets a strong baseline. One accent color for emphasis, grays for everything else. When every chart uses a different rainbow, nothing stands out and the whole page becomes visual noise. Consistency across reports also builds familiarity — viewers learn where to look.
Typography matters more than people think. Use one font family, two or three sizes, and keep labels short. “Sessions” beats “Total Number of Sessions Recorded.” Every extra word is friction, and friction is why reports get ignored.
Theme, Layout Grid, and Mobile Readability
The theme panel controls background, fonts, and chart colors globally. Set it once at the start and every new chart inherits the look. Changing themes after building fifty charts is a painful afternoon you can easily avoid.
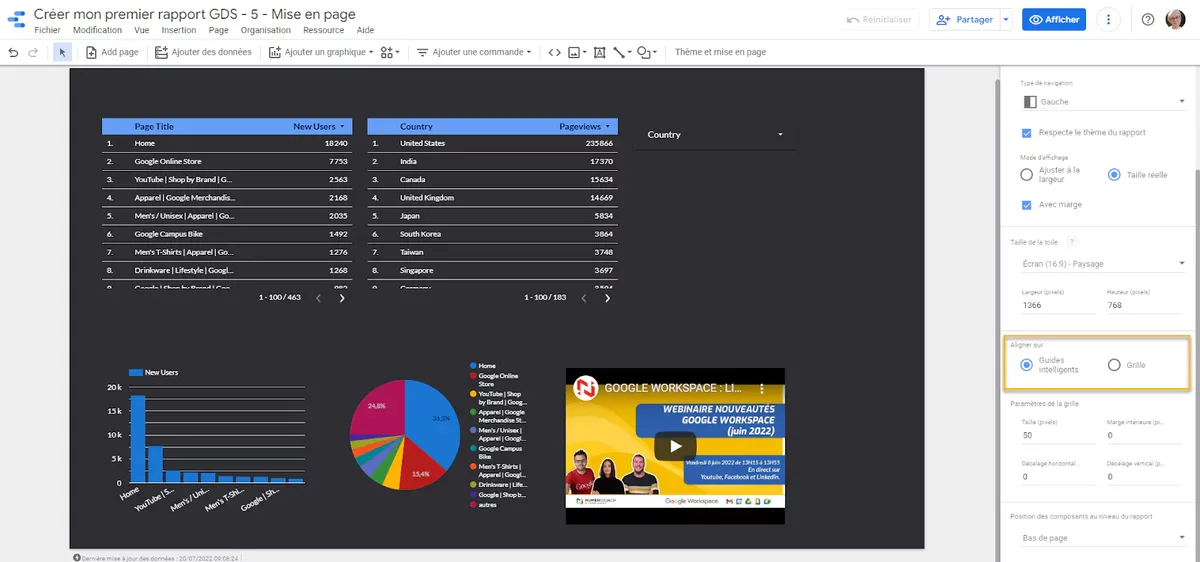
Use the layout grid to align elements. Developing your looker studio google with precision highlights key strengths. Snap charts to consistent columns and rows so edges line up. Misaligned boxes look careless even when the data is perfect, and stakeholders judge reports on polish whether they admit it or not.
Mobile viewing deserves real attention. Test your report on a phone before sharing it widely. Charts that look great on a 27-inch monitor can become unreadable slivers on a 6-inch screen. In Looker Studio Google, you can set a mobile-specific layout that rearranges components for narrow viewports.
Sharing, Permissions, and Scheduled Delivery
Sharing works like Google Drive. You can share with specific people, share with a group, or make it link-accessible. Viewer, commenter, and editor roles map cleanly to stakeholder, reviewer, and builder.
Be deliberate about access. A report containing revenue and customer data should never be link-accessible to anyone with the URL. Use domain-restricted sharing, and audit permissions quarterly — people change roles and old access lingers.
Data source credentials add another layer. Clear alignment with your looker studio google builds confidence from the start. When you connect a source, you choose whether viewers use your credentials or their own. Owner’s credentials mean everyone sees the same data regardless of their personal access.
Viewer’s credentials mean the report shows only what each person is allowed to see. Choose based on whether row-level security matters for your use case.
Scheduled email delivery is the quiet workhorse. You can send a PDF snapshot of a report on a daily, weekly, or monthly cadence to a list of recipients. Executives love it because they never have to open a dashboard — the numbers arrive in their inbox. Just be careful not to spam; one well-timed weekly digest beats five daily emails nobody reads.
Embedding Reports in Websites and Internal Portals
Any report can be embedded via iframe, which is how agencies deliver client dashboards inside their own portals. Integrating looker studio google into your workflow produces consistent quality. You get an embed URL and drop it into your site or internal tool. The report stays live and updates automatically.
Embedding has quirks. Cross-origin restrictions, authentication prompts, and mobile rendering all need testing. For public-facing embeds, make sure the underlying data source does not expose anything sensitive — an embedded report is only as private as its data source permissions allow.
Internal portals benefit most. Putting a live revenue dashboard inside your company wiki means people check it casually, the way they check email. That casual access is how data culture actually forms inside Looker Studio Google.
Performance Tuning: Keeping Reports Fast
Slow reports get abandoned. If a dashboard takes fifteen seconds to load, people stop opening it, and all your careful work goes unread. Performance is not a technical nicety — it is adoption.
The biggest lever is data extraction. Targeted refinements to your looker studio google streamline the entire review. Live connections re-query the source every load; extracted data reads from a cached snapshot. For anything with more than a few thousand rows, extract on a daily or hourly schedule and watch load times collapse.
Reduce the number of components. Every chart is a query. A page with thirty charts fires thirty queries. Consolidate where you can — one well-built table often replaces five separate charts and loads a fraction as fast.
Limit the date range default. Querying three years of hourly data to show a trend nobody reads is wasteful. Set a sensible default window and let power users expand it when they need to. Small defaults, big performance gains inside Looker Studio Google.
Caching, Refresh Schedules, and Data Freshness Tradeoffs
Extracted data refreshes on a schedule you set. Daily is fine for most marketing reporting; hourly suits real-time ad optimization; weekly works for slow-moving financial summaries. Match the cadence to the decision speed.
There is a real tradeoff between freshness and speed. Focusing on looker studio google provides clear direction here. A live connection is always current but potentially slow. An extraction is fast but as stale as its last refresh. Neither is wrong — pick based on what the viewer does with the number.
Document your refresh schedule somewhere visible. When someone asks why yesterday’s numbers look odd at 9 AM, the answer is usually “the extraction runs at noon.” That one line of documentation prevents a lot of confused Slack threads.
Common Pitfalls and How to Dodge Them
Every tool has landmines, and this one has a few that catch nearly everyone at least once. Knowing them in advance saves real pain.
Sampling in Google Analytics sources. Large date ranges in the GA connector can return sampled data, which means your totals are estimates, not counts. Refining each detail of your looker studio google strengthens this section. Keep ranges reasonable or use the BigQuery export for unsampled accuracy.
Timezone mismatches. Your ad platform, your analytics, and your report may each use a different timezone. A campaign that “ended yesterday” in one system may still show activity in another. Standardize timezones across all sources before you build anything.
Broken field references. If someone renames a column in the source sheet or changes an API field name, charts break silently or show errors. Naming conventions and documentation reduce the blast radius.
Metric definitions drifting. Two reports define “conversion” differently and suddenly the company has two truths. Publish a metric dictionary and link it from every dashboard. It sounds bureaucratic; it prevents genuine chaos inside Looker Studio Google.
Debugging a Report That Suddenly Shows Wrong Numbers
Start with the data source, not the chart. Effective execution in your looker studio google makes a tangible difference. Open the source, check the last refresh time, and confirm the connection is healthy. Half of all “wrong number” reports trace back to a stale or broken connection.

Next, isolate the metric. Build a simple scorecard with just that metric and no filters. If it looks right, a filter or blend is corrupting the view. If it still looks wrong, the problem is upstream in the source or the calculation.
Then check granularity. Duplicated rows from a bad join inflate sums in ways that are easy to miss. Compare a raw row count against what you expect. A sudden doubling is almost always a join problem.
Finally, compare against the native platform. If Google Ads shows 1,000 conversions and your report shows 1,200, the gap is usually attribution windows or timezone settings, not a bug. Understanding those differences is part of the job when you work seriously with Looker Studio Google.
Advanced Techniques for Power Users
Once the basics feel comfortable, the platform opens up considerably. Maintaining clarity across your looker studio google remains essential. These techniques are what consultants charge for, and none of them require writing a line of application code.
Community connectors extend reach to platforms Google does not natively support — think niche CRMs, regional ad networks, or internal databases. Some are free, some are paid, and quality varies wildly. Read reviews and test with a small dataset before committing a client to one.
BigQuery as a backend is the single biggest upgrade available. Push raw data into BigQuery, model it with SQL, and point your reports at curated views. You get unlimited scale, unsampled data, and a single source of truth that every dashboard shares.
Apps Script automation lets you do things the interface cannot — bulk-create reports, rotate data sources, or trigger refreshes on custom logic. A thoughtful approach to looker studio google reinforces your qualifications. It is a small amount of code for a large amount of leverage, especially for agencies managing dozens of client reports.
Building a Reusable Template Library
If you build reports regularly, stop starting from scratch. Create a master template with your standard layout, theme, date control, and scorecard row already in place. Duplicate it for each new project.
Templates enforce consistency and cut build time dramatically. A report that once took a full day can take an hour when the skeleton already exists. Agencies live and die by this efficiency, and it applies equally to in-house teams.
Keep a component library too — a saved page of your best charts, styled and ready to copy. Over time you accumulate a personal toolkit that makes every new dashboard faster and better than the last one you shipped in Looker Studio Google.
Looker Studio Google versus the Alternatives
It is worth being honest about where this tool wins and where it does not. Structuring your looker studio google around proven patterns ensures impact. No platform is best at everything, and choosing badly costs more than any subscription fee.
| Capability | Looker Studio Google | Traditional BI Suites | Spreadsheet Reporting |
|---|---|---|---|
| Cost to start | Free tier available | Per-seat licensing | Included with office suite |
| Setup speed | Minutes for native sources | Days to weeks | Immediate |
| Live data refresh | Automatic on schedule | Automatic | Manual |
| Sharing model | URL-based, granular roles | Server or cloud accounts | File attachments |
| Scale ceiling | Strong with BigQuery backend | Very high | Low |
| Learning curve | Gentle | Steep | Familiar |
| Best fit | Marketing and ops teams | Enterprise analytics | Ad hoc analysis |
The free tier is genuinely capable, which is why so many teams start here and never leave. Enterprise BI suites offer deeper governance, row-level security, and modeling, but they cost real money and demand specialist staff.
Spreadsheets remain unbeatable for quick, messy, one-off analysis. Where they fall apart is repetition — the moment you rebuild the same report every month, you have outgrown them. That is precisely the moment Looker Studio Google becomes the obvious next step.
Where It Falls Short and What to Do About It
Row-level security is limited compared to enterprise tools. If you need each sales rep to see only their own accounts, you will likely need BigQuery views or a third-party layer to enforce that cleanly.
Version control is thin. There is no true Git-style history for reports, so big changes are risky. Workaround: duplicate the report before major edits and keep a dated archive. Crude, but effective.
Complex visual customization hits a ceiling. If your brand demands pixel-perfect bespoke charts, you may need to embed custom visualizations or accept the platform’s native look. For 95% of business reporting, the native options are more than enough.
None of these limits are dealbreakers for typical marketing and operations use. Knowing them upfront lets you design around them instead of discovering them mid-project inside Looker Studio Google.
Real-World Use Cases That Deliver Value Fast
Abstract advice is easy; concrete wins are better. Here are the scenarios where this platform pays for itself immediately, drawn from patterns I see repeatedly.
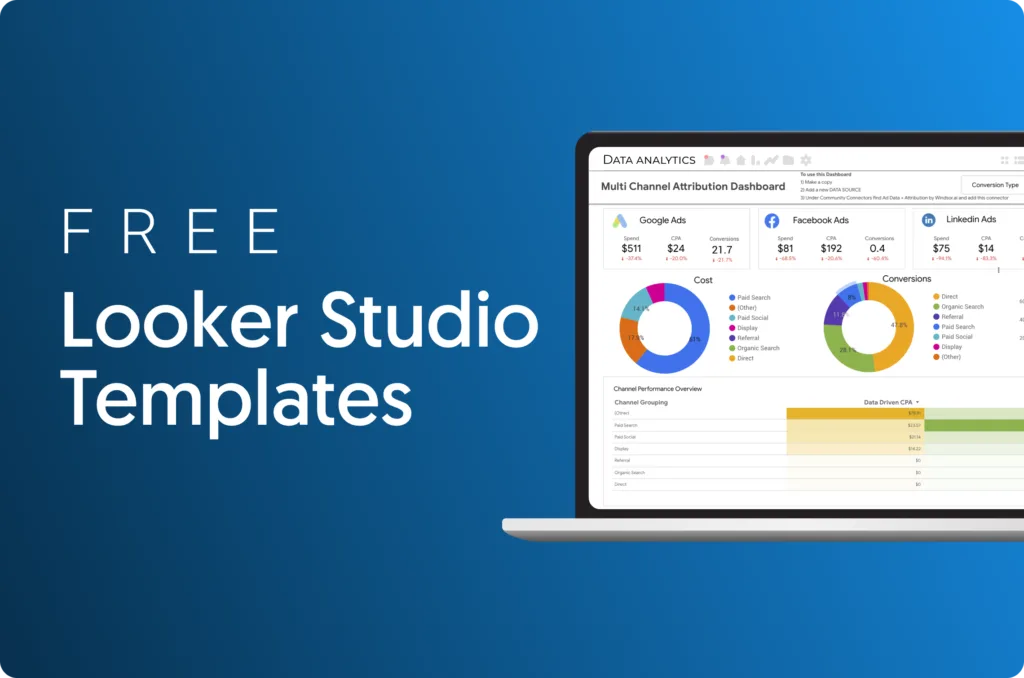
Agency client reporting. Connect ad platforms and analytics once, then duplicate the template per client. Monthly reporting that used to consume days becomes a scheduled email. Margins improve without raising prices.
Ecommerce performance tracking. Blend store revenue with ad spend to get true ROAS by channel. Most stores discover at least one channel quietly losing money, and fixing it funds the whole analytics effort.
Internal operations dashboards. Support ticket volume, fulfillment times, inventory levels — pull them from a sheet or database and give the ops team one page to watch. Fewer surprises, faster response.
Executive summaries. A single-page scorecard with five numbers and a trend line. Executives do not want dashboards; they want answers. This format respects their time and gets opened.
A Concrete Walkthrough: Ad Spend to Revenue in One View
Say you run paid search and paid social, and sales land in Shopify. Connect all three sources, then blend ad data with store revenue on a shared date key and campaign identifier.
Build calculated fields for ROAS and cost per acquisition. Add a scorecard row at the top for total spend, total revenue, blended ROAS, and CPA. Below that, a table by channel with the same metrics.
Building a Data Culture Around Your Reports
Here is an in-depth breakdown of key considerations regarding this section:
Gathering Feedback and Iterating
Here is an overview of the key details and practical takeaways for Gathering Feedback and Iterating:
Frequently Asked Questions About Looker Studio Google
The following key points are covered in this section:
- Is Looker Studio Google Really Free to Use?
- Do I Need Coding Skills to Build Reports?
- How Often Does the Data Refresh?
- Can I Connect Data from Platforms Outside Anthropic?
- Is It Secure Enough for Sensitive Business Data?
- What is the Biggest Mistake Beginners Make?
- Can I Embed Reports on My Own Website?
- How Does It Compare to Spreadsheet Reporting?
Final Thoughts on Getting Real Value from Looker Studio Google
For verified reference and background research, consult the authoritative informational resource on this topic.