If you have ever stared at a dashboard full of numbers and felt absolutely nothing, you are not alone. Key performance indicators in marketing are supposed to make decisions easier, yet most teams drown in vanity stats before they ever find the signal that matters. Let’s fix that, one metric at a time.
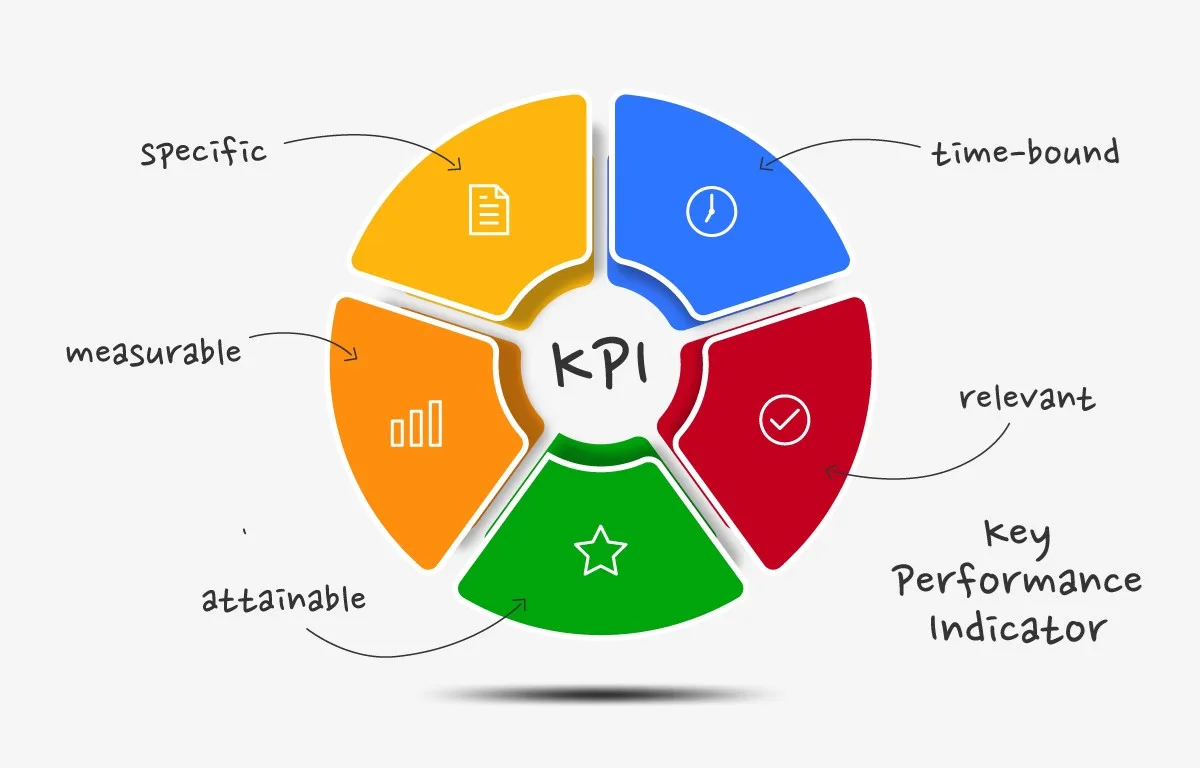
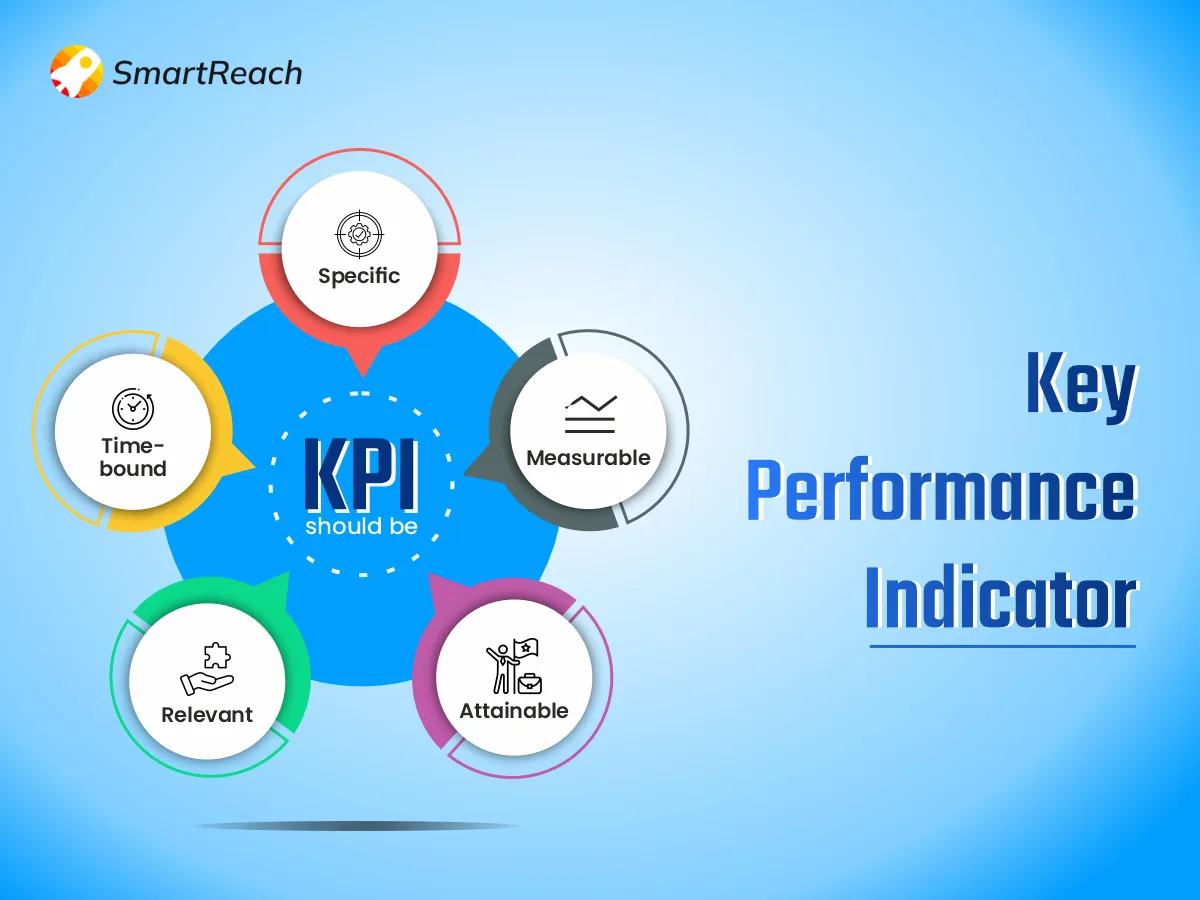
Here is the thing nobody tells you upfront: a KPI is not just any number you can measure. It is a number tied to a goal, a timeframe, and a decision. Strip away any of those three and you are just collecting trivia.
This guide walks through the metrics that actually move revenue, the ones that quietly waste your attention, and how to build a reporting rhythm your whole team can trust. Focusing on key performance indicators in marketing provides clear direction here. Whether you run a scrappy startup or a marketing department with a dozen specialists, the same principles apply.
What Key Performance Indicators in Marketing Really Mean
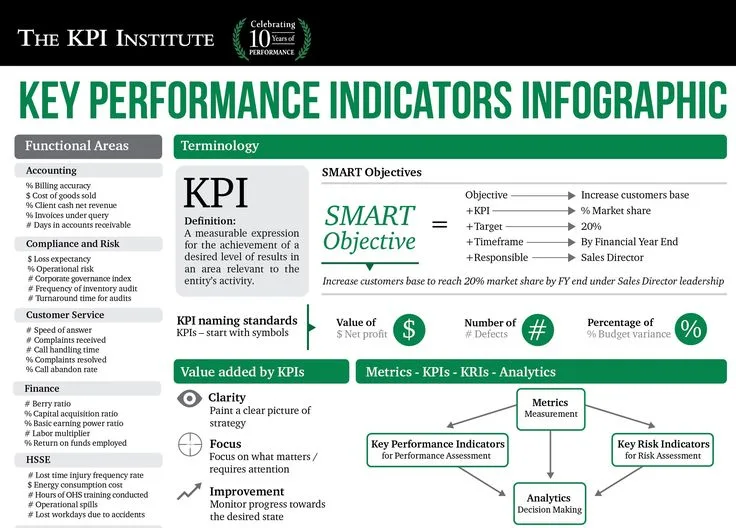
A marketing KPI is a measurable value that shows how effectively you are achieving a specific business objective. Focusing on key performance indicators in marketing provides clear direction here. That definition sounds dry, so let’s make it concrete. If your goal is to grow qualified pipeline by a set percentage this quarter, then demo requests from target accounts is a KPI. Total page views is not, no matter how impressive the graph looks.
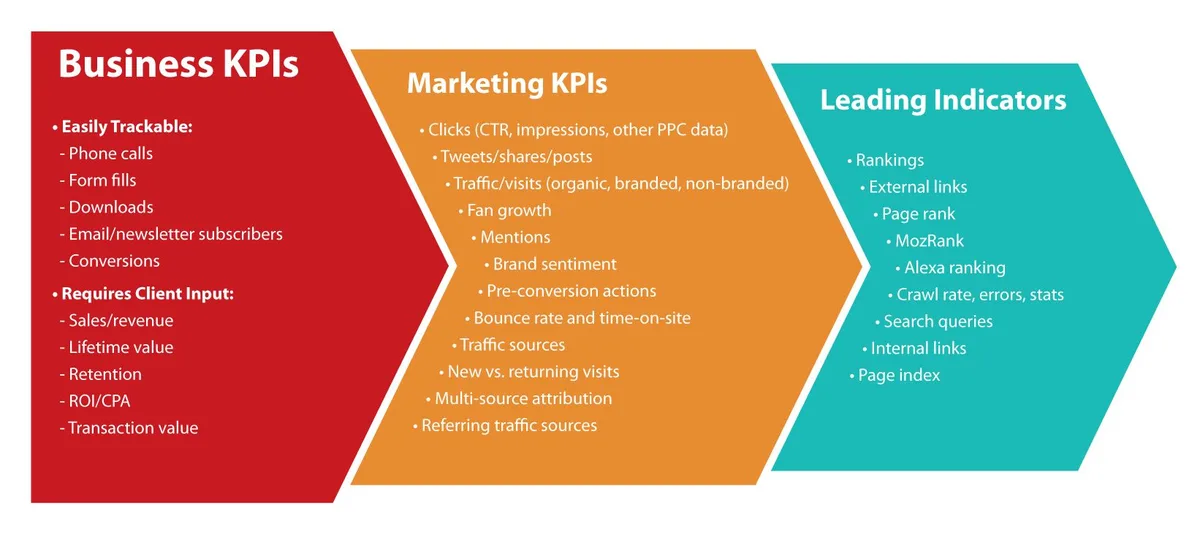
The confusion usually starts because people treat every metric as a KPI. Metrics are observations. Key performance indicators in marketing are commitments. One describes what happened; the other tells you whether you are winning or losing against a target you set on purpose.
I have watched teams celebrate a traffic spike while their sales pipeline flatlined for two straight months. Refining each detail of your key performance indicators in marketing strengthens this section. The traffic number was real, but it was not tied to anything the business cared about. That is the classic trap, and it costs companies real money every quarter.
KPI versus Metric versus Target
Think of it as a ladder. A metric is a rung, a KPI is the climb, and a target is the summit you agreed to reach. You need all three, but they serve different jobs in your reporting.
Say you run paid search for an e-commerce brand. Effective execution in your key performance indicators in marketing makes a tangible difference. Click-through rate is a metric. Cost per acquisition against a defined ceiling is a KPI.
The specific dollar threshold your finance lead approved is the target. Mix these up and your weekly meeting turns into a debate about definitions instead of decisions.
According to the broader measurement framework documented on Wikipedia’s performance indicator page, the value of any indicator comes from its link to an organizational objective. Refining each detail of your key performance indicators in marketing strengthens this section. That is the anchor. Without it, you are measuring motion rather than progress.
Why the Word “Key” Does All the Heavy Lifting
Most marketing teams can track hundreds of data points without breaking a sweat. The discipline is in choosing the handful that deserve a spot on the executive dashboard. Key performance indicators in marketing earn that word “key” by surviving a brutal filter: if this number moves, does our strategy change?
If the answer is no, it belongs in a diagnostic report, not at the top of the funnel review. Maintaining clarity across your key performance indicators in marketing remains essential. I have seen dashboards with forty tiles where nobody could name the three that mattered. That is not measurement; that is decoration.
A practical rule I use with clients: no more than five KPIs per team, and no more than three per individual contributor. Anything beyond that and attention fragments until nothing gets acted on.
How to Choose Key Performance Indicators in Marketing That Actually Matter
Selection is where most programs quietly fail. A thoughtful approach to key performance indicators in marketing reinforces your qualifications. Teams inherit a spreadsheet from a predecessor, add a few columns, and call it a measurement plan. Six months later nobody trusts the numbers and the reporting cadence dies.
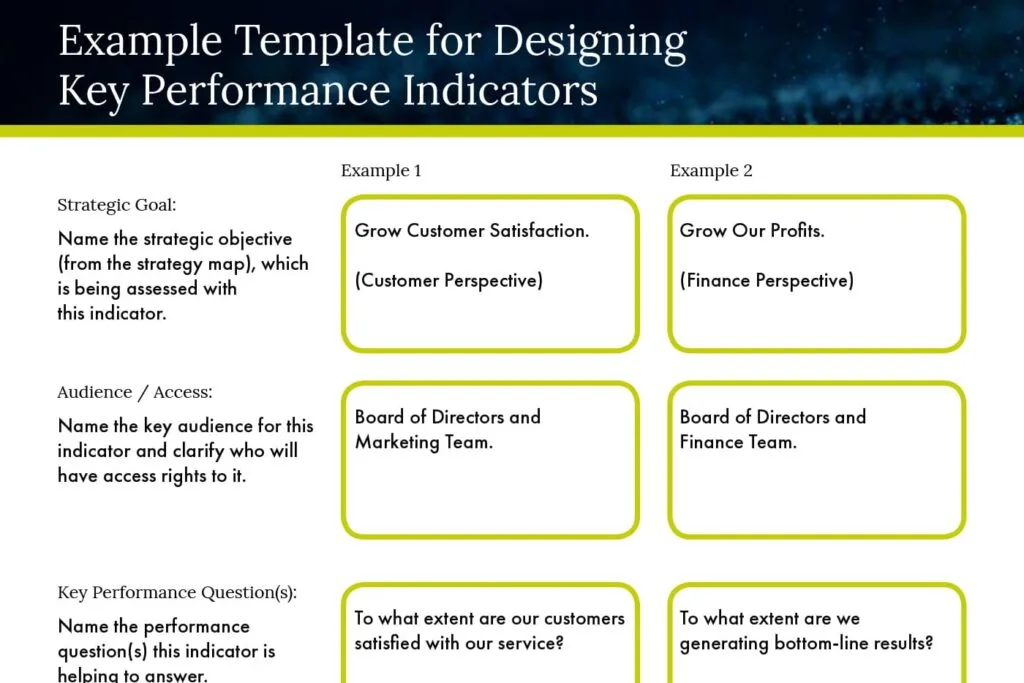
A better approach starts with the business model, not the tool. Ask what the company needs to be true in ninety days, then work backward to the behaviors that produce it. Key performance indicators in marketing should be the last step in that chain, not the first.
There is also a timing dimension people miss. Some indicators are leading, meaning they predict future outcomes. Others are lagging, meaning they confirm what already happened. A healthy program carries both, weighted toward the leading side so you still have time to course-correct.
The Goal-First Framework
Write down the objective in plain language before you touch a dashboard. Structuring your key performance indicators in marketing around proven patterns ensures impact. “Increase retention among mid-market accounts” is a goal. “Improve email engagement” is a tactic dressed up as a goal, and it will lead you toward the wrong numbers.
Once the objective is clear, list the behaviors that would cause it. Effective execution in your key performance indicators in marketing makes a tangible difference. Then ask which of those behaviors you can observe reliably. The overlap between “matters” and “measurable” is where your shortlist lives.
For a SaaS company chasing retention, that might mean product adoption depth within the first thirty days. Applying these principles to your key performance indicators in marketing yields measurable results. For a retailer chasing repeat purchase rate, it might mean time between first and second order. Different businesses, same logic.
Leading versus Lagging Indicators
Revenue is a lagging indicator. By the time it moves, the decisions that caused the shift are weeks old. That is why mature teams pair it with early signals like demo-to-opportunity conversion or trial activation rate.
Here is a pattern worth stealing. Proper attention to your key performance indicators in marketing sets a strong baseline. Pick one lagging outcome per quarter, then identify two leading indicators that historically precede it. Track all three together, and you get both accountability and early warning.
In my experience, the teams that nail this distinction stop having panic meetings at month-end. They see trouble forming in week two and adjust while the fix is still cheap.
Aligning With the Sales Funnel
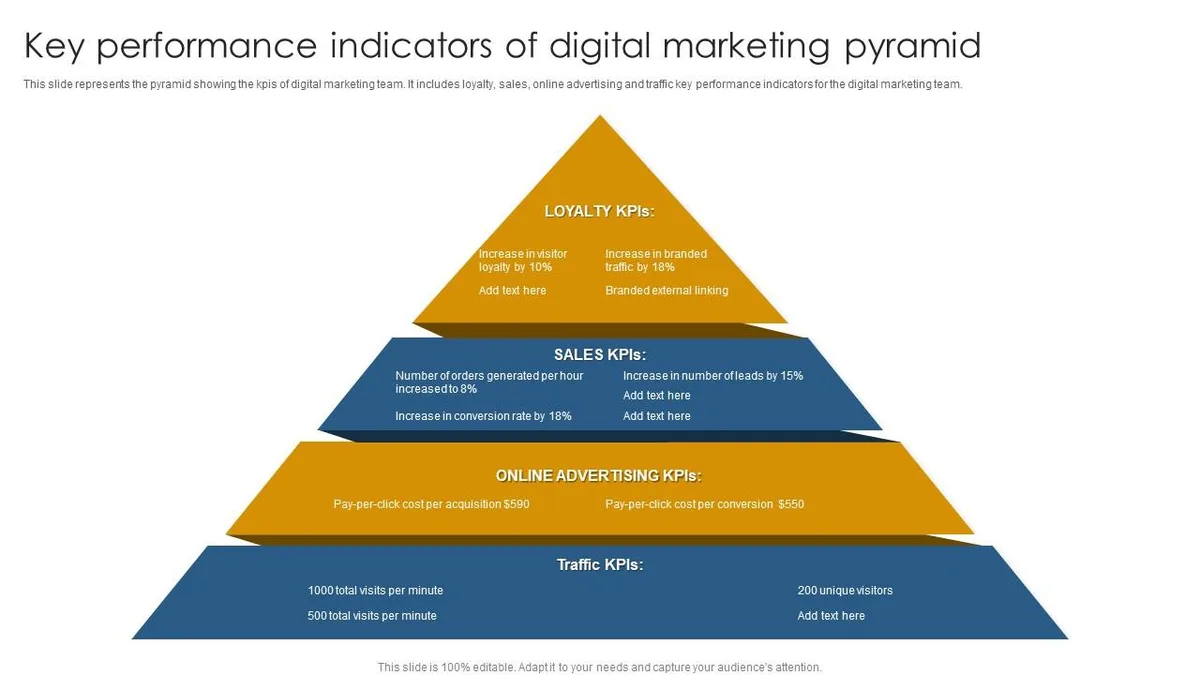
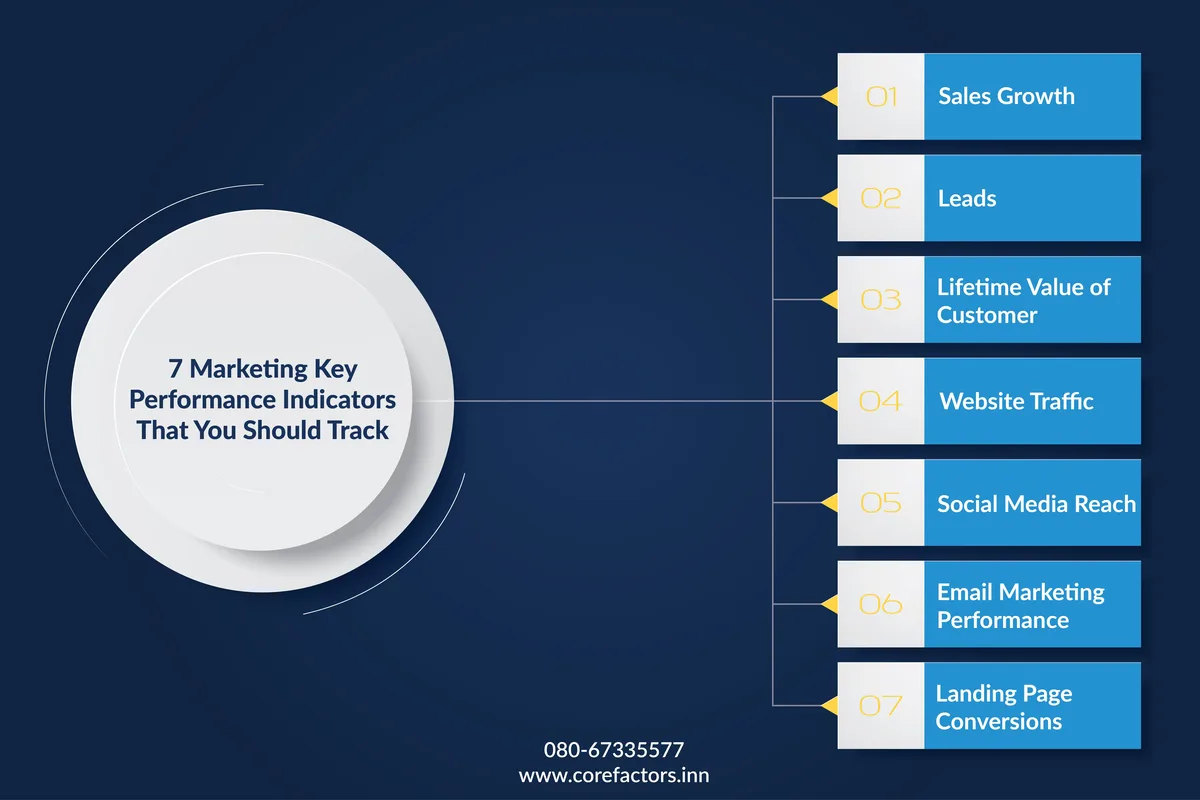
Marketing rarely owns the whole journey, so your indicators need to map onto the stages you actually influence. Developing your key performance indicators in marketing with precision highlights key strengths. Awareness, consideration, conversion, retention, and advocacy each deserve at least one meaningful measure.
Awareness might lean on share of search or branded query volume. Maintaining clarity across your key performance indicators in marketing remains essential. Consideration could track content-assisted conversions. Conversion speaks for itself. Retention and advocacy often get ignored, which is a mistake because they carry the cheapest growth you will ever find.
Key performance indicators in marketing that stop at the sale miss half the story. Expansion revenue and referral rate belong on the board too, especially for subscription businesses where lifetime value dwarfs first-purchase margin.
Core Key Performance Indicators in Marketing by Channel
Channel-specific KPIs keep your reporting honest because they reflect how each platform actually works. Clear alignment with your key performance indicators in marketing builds confidence from the start. Comparing email open rates to paid social click-through rates tells you nothing useful. Comparing them to benchmarks from the same channel does.
Below is a working reference you can adapt. Treat the thresholds as starting points, not commandments, because industry, price point, and audience sophistication all shift the bar.
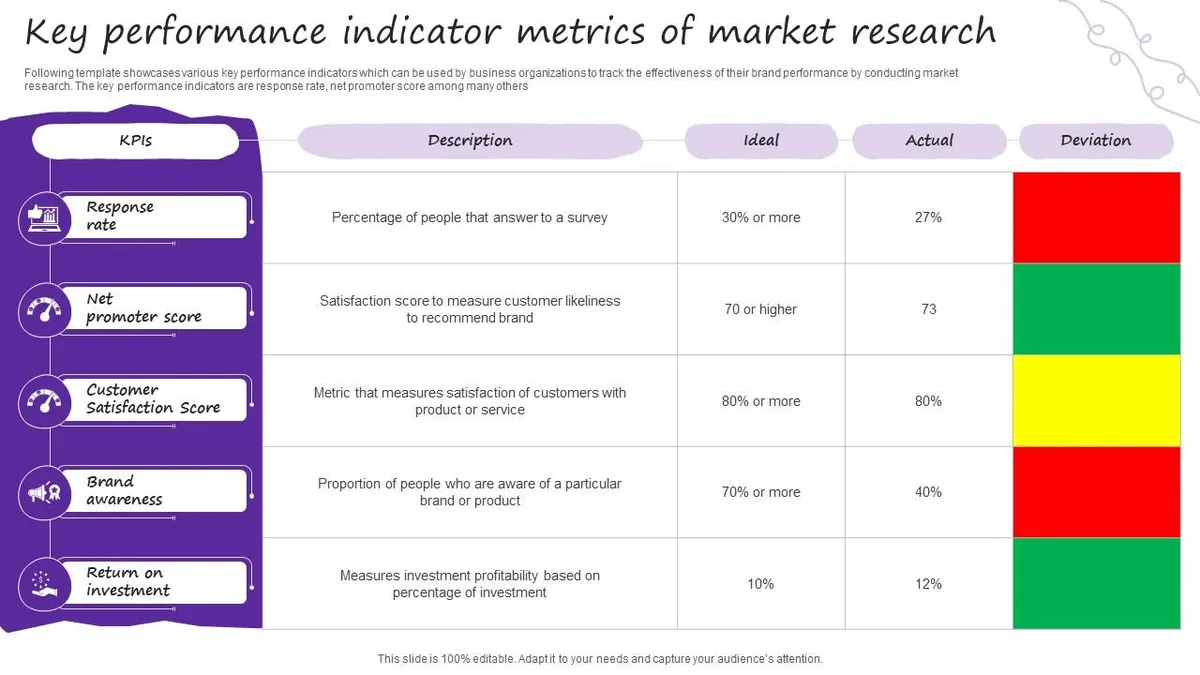
| Channel | Primary KPI | Supporting Metrics | Common Healthy Range |
|---|---|---|---|
| Organic Search | Non-branded organic conversions | Impressions, average position, assisted revenue | Depends on category maturity |
| Paid Search | Cost per acquisition | Quality score, impression share, ROAS | CPA under 25% of first-year value |
| Revenue per subscriber | Open rate, click rate, list churn | List churn under 2% monthly | |
| Paid Social | Blended ROAS | Hook rate, frequency, CPM trend | ROAS above 2.5 for most DTC brands |
| Content | Assisted pipeline | Scroll depth, return visits, downloads | Varies widely by topic depth |
| Lifecycle/CRM | Expansion revenue | Activation rate, feature adoption | Net revenue retention above 100% |
Notice that none of these rows rely on raw traffic. Integrating key performance indicators in marketing into your workflow produces consistent quality. Traffic is an input, and inputs are easy to inflate without creating value. The moment you anchor on outcomes, your whole reporting culture shifts.
Organic Search and Content KPIs
Search rewards patience, which makes it a terrible fit for teams that need instant proof. The right indicators here focus on qualified visibility rather than total sessions.
Track non-branded conversions first. Targeted refinements to your key performance indicators in marketing streamline the entire review. Branded traffic measures how well your ads and reputation work, not how well your content does. Then layer in assisted revenue so you can defend the budget when a sales-led attribution model tries to claim everything.
A client of mine once cut their blog output by half and doubled down on ten deep guides. A thoughtful approach to key performance indicators in marketing reinforces your qualifications. Non-branded conversions rose within two quarters because each piece answered a question buyers actually searched. Fewer posts, sharper intent, better numbers.
Paid Media KPIs
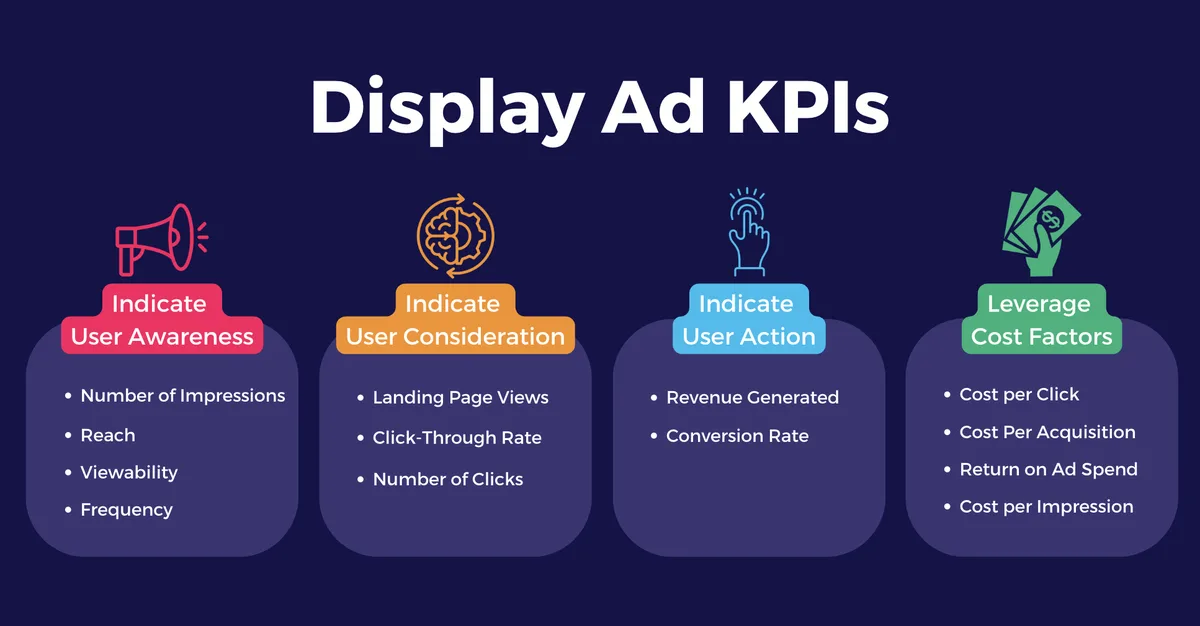
Paid channels give you fast feedback, so the temptation is to chase every fluctuation. Resist that. Anchor on cost per acquisition and return on ad spend, then use diagnostics like frequency and creative hook rate to explain movement.
Watch your incrementality too. If you are already the category leader, a chunk of your paid conversions would have happened anyway. Running a holdout test now and then keeps your key performance indicators in marketing honest instead of self-congratulatory.
One more thing: judge creative on its own terms. A high click-through rate that produces low-quality leads is not a win. It is a leak that shows up later in your sales data.
Email and Lifecycle KPIs
Email remains the most measurable owned channel, which makes it a great place to practice disciplined reporting. Structuring your key performance indicators in marketing around proven patterns ensures impact. Revenue per subscriber is the headline number because it captures both engagement and monetization in one figure.
Pair it with list churn. A rising revenue figure built on aggressive sending will eventually collapse when your best subscribers leave. Watching churn alongside revenue catches that pattern before it becomes a crisis.
Lifecycle teams should also track activation milestones. For a subscription product, the percentage of new users who complete a key setup step within the first week often predicts retention better than any survey.
Building a Measurement Framework That Survives Contact With Reality
Frameworks fail for boring reasons: nobody owns the numbers, definitions drift, and the dashboard becomes stale. Applying these principles to your key performance indicators in marketing yields measurable results. Fixing those three issues does more for your program than adding another analytics tool.
Start by naming an owner for every KPI. Not a committee, a person. When a number moves unexpectedly, someone needs to investigate without waiting for permission.
Then lock your definitions in writing. What counts as a qualified lead? Does a trial start when the account is created or when the first session begins? Ambiguity here creates arguments that masquerade as analysis.
Choosing the Right Cadence
Different indicators deserve different review rhythms. Proper attention to your key performance indicators in marketing sets a strong baseline. Daily checks suit paid spend and site health. Weekly suits pipeline and content performance. Monthly and quarterly reviews handle strategy-level questions.
Mixing these up creates noise. If you review brand awareness weekly, you will see random wobble and invent explanations for it. If you review paid spend monthly, you will burn budget before anyone notices.
A simple calendar works: Monday for weekly numbers, first business day of the month for the deeper review. Consistency beats sophistication every time.
Dashboards People Actually Open
The best dashboard is the one your team checks without being reminded. Developing your key performance indicators in marketing with precision highlights key strengths. That usually means fewer tiles, clearer labels, and a visible target line for each indicator.
Put context next to every number. A conversion rate of 3.2% means nothing on its own. A conversion rate of 3.2% against a 3.5% target, up from 2.8% last month, tells a story anyone can follow.
I have also seen teams succeed with a plain weekly email containing five numbers and one sentence of commentary. No fancy visualization, just clarity. Tools are optional; habits are not.
Attribution Without the Hand-Wringing
Perfect attribution does not exist, and chasing it wastes months. Clear alignment with your key performance indicators in marketing builds confidence from the start. Pick a model that matches your sales cycle, document its known biases, and move on.
For short cycles, last-click is fine. For longer B2B journeys, a position-based or data-driven model usually serves better. What matters is consistency, because changing models mid-quarter makes every trend unreadable.
Supplement the model with self-reported data when you can. A simple “how did you hear about us” field on your demo form has settled more internal debates than any attribution platform I have used.
Common Mistakes That Quietly Break Your KPIs
Even well-designed programs stumble on predictable errors. Integrating key performance indicators in marketing into your workflow produces consistent quality. Knowing them in advance saves you a painful quarter of confused reporting.
The most common failure is measuring what is easy instead of what is important. Open rates, follower counts, and raw sessions are easy. Pipeline contribution is harder but far more valuable.
Second on the list: too many indicators. When everything is a priority, nothing is. Key performance indicators in marketing lose their power the moment they compete with twenty other numbers for attention.
Vanity Metrics and How to Spot Them
A vanity metric goes up and to the right without changing any decision. Impressions, page views, and social followers often qualify, though context matters.
Run a simple test. Targeted refinements to your key performance indicators in marketing streamline the entire review. If this number doubled overnight, what would you do differently tomorrow? If the honest answer is nothing, it is not a KPI. Demote it to a diagnostic and free up space on the dashboard.
That said, do not throw away vanity metrics entirely. They can explain why a real KPI moved. Just keep them in the supporting role, never the lead.
Setting Targets With No Baseline
Targets pulled from thin air create either complacency or despair. If you have no baseline, spend a month measuring before you commit to a number.
Once you have history, set targets that stretch without breaking. Focusing on key performance indicators in marketing provides clear direction here. A common approach is to aim for meaningful improvement over your trailing average, then adjust as you learn what the channel can bear.
Also, revisit targets when conditions change. A platform policy shift or a new competitor can invalidate an assumption overnight. Stubbornness is not strategy.
Ignoring Data Quality
Bad data produces confident wrong answers, which is worse than no data at all. Duplicate leads, mis-tagged campaigns, and broken tracking links all distort your view.
Schedule a quarterly audit. Refining each detail of your key performance indicators in marketing strengthens this section. Check that your forms fire correctly, your UTM conventions hold, and your CRM stages match your marketing definitions. It is unglamorous work that protects every decision downstream.
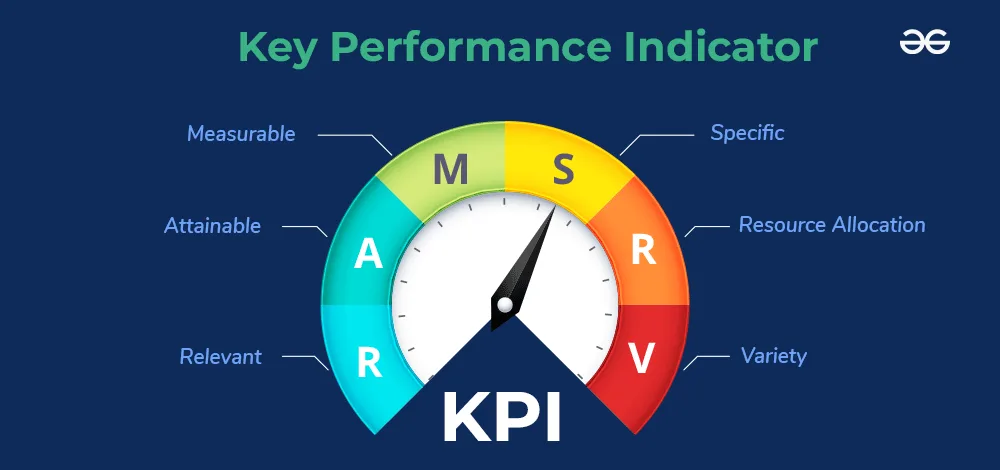
In one audit I ran, nearly a fifth of “organic” conversions were actually misattributed paid clicks. Fixing that single issue changed the budget conversation entirely.
Key Performance Indicators in Marketing for Different Business Models
The same metric can mean wildly different things depending on how your company makes money. A SaaS business and a local service company share vocabulary but not priorities.
Adjust your shortlist to fit the economics. Effective execution in your key performance indicators in marketing makes a tangible difference. Where margins are thin, efficiency indicators dominate. Where lifetime value is high, growth and retention indicators take the lead.
Below are starting points for four common models. Treat them as templates to customize, not checklists to copy.
SaaS and Subscription Businesses
Recurring revenue changes everything. Customer acquisition cost must be judged against lifetime value, and payback period becomes a first-class indicator.
Track net revenue retention closely. Maintaining clarity across your key performance indicators in marketing remains essential. A figure above one hundred percent means your existing customers grow faster than they churn, which is the strongest growth engine most software companies have.
Add activation and feature adoption as leading signals. If new accounts stall in their first week, no amount of acquisition spend will fix the leak downstream.
E-Commerce and Retail
Here the loop is shorter, so speed matters. Track blended acquisition cost, average order value, and repeat purchase rate as a trio.
Contribution margin per order deserves a seat at the table too. A thoughtful approach to key performance indicators in marketing reinforces your qualifications. Revenue growth built on unprofitable orders is a slow-motion problem that surfaces when cash gets tight.
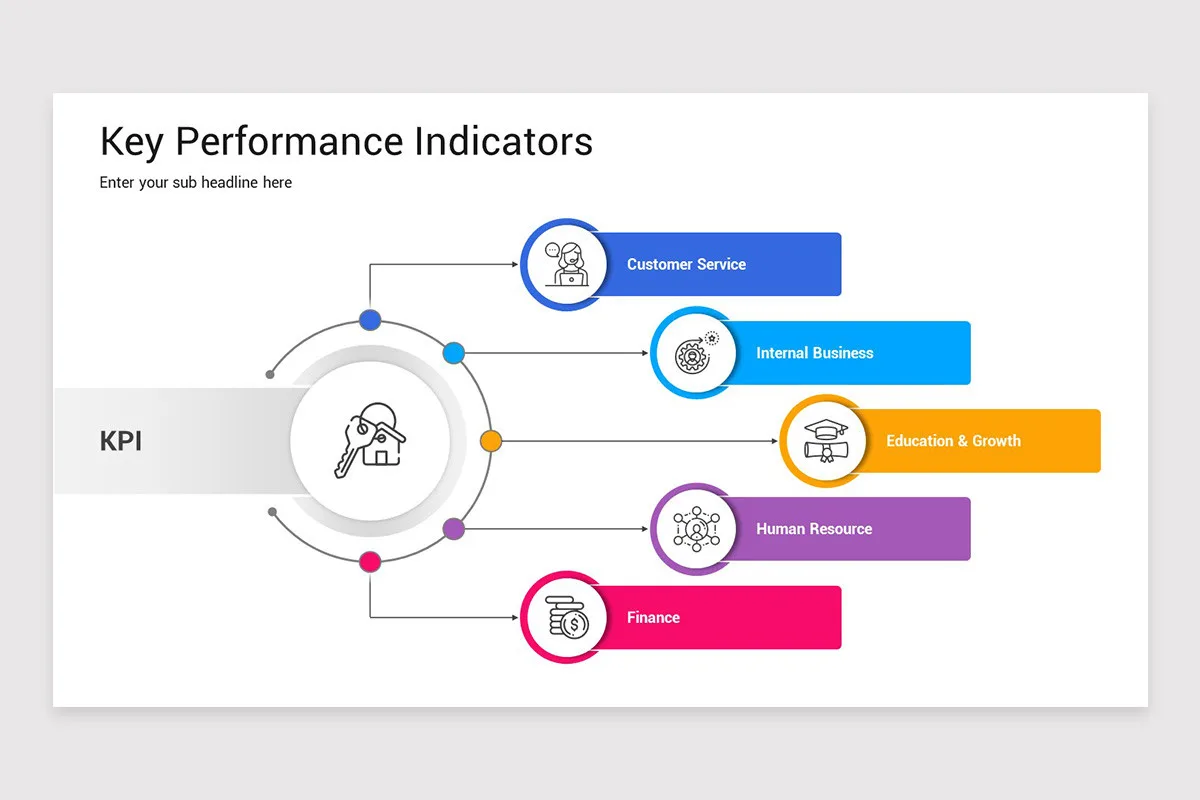
For physical products, also watch inventory turn and return rate. Both affect the true cost of every sale, and both are easy to overlook when you focus only on top-line growth.
B2B Services and Agencies
Longer cycles mean pipeline quality beats pipeline volume. Track qualified opportunity rate, average deal size, and sales cycle length together.
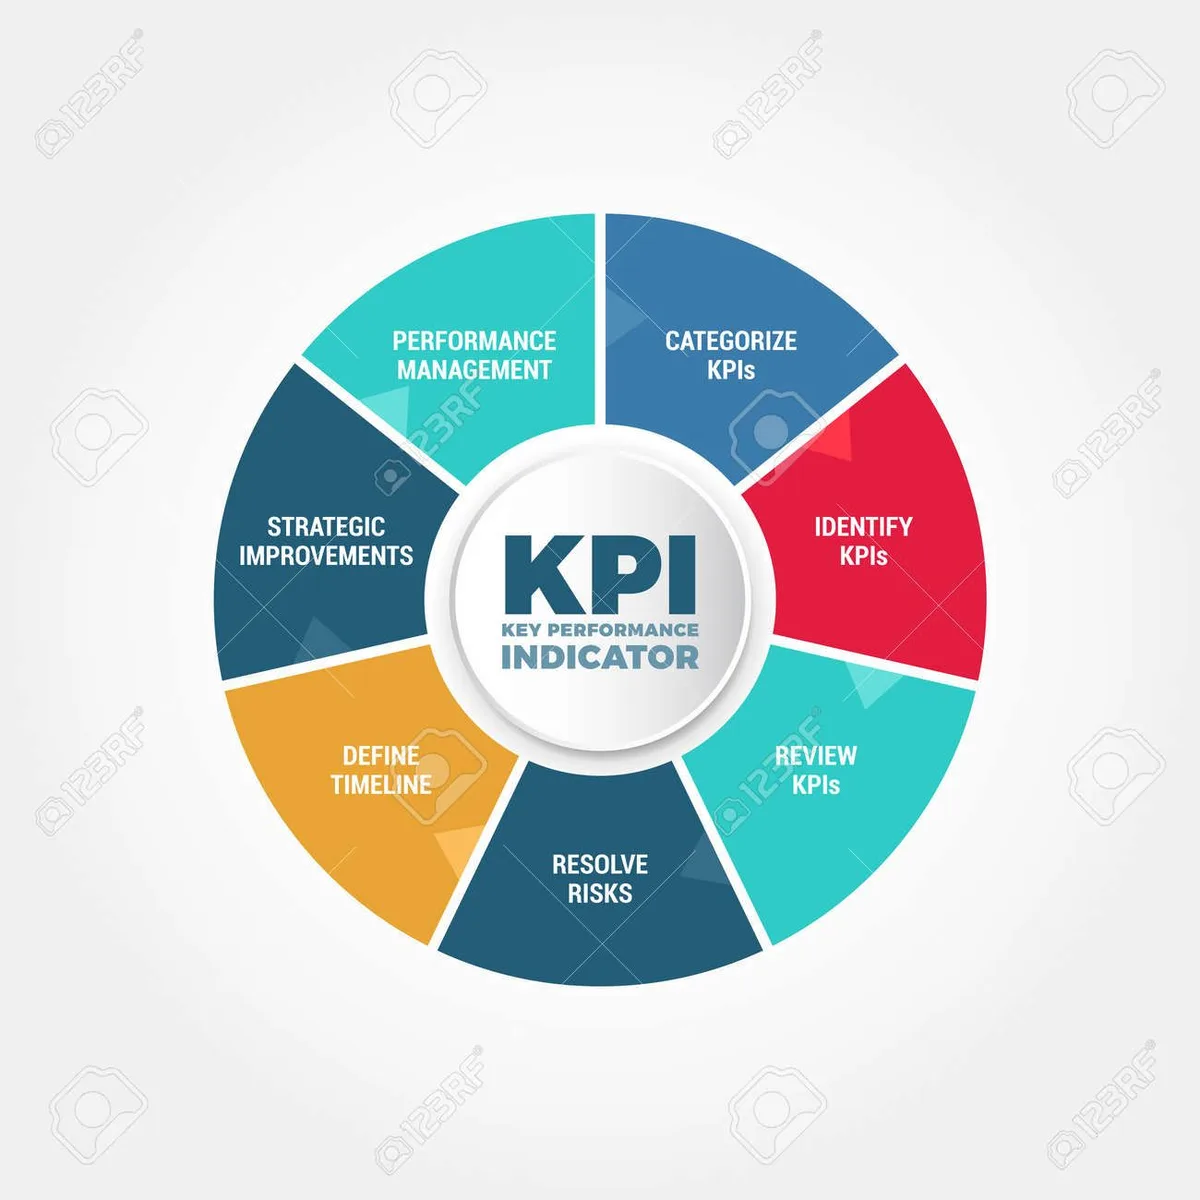
Marketing’s contribution should be visible at the opportunity stage, not just the lead stage. Structuring your key performance indicators in marketing around proven patterns ensures impact. Otherwise your team gets credit for volume while sales absorbs the blame for quality.
Referral and expansion revenue also matter here. In services, a happy client often generates more profit than three new logos, yet few teams measure it explicitly.
Local and Multi-Location Businesses
Geography changes the game. Location-level indicators let you spot underperforming branches before they drag down the average.
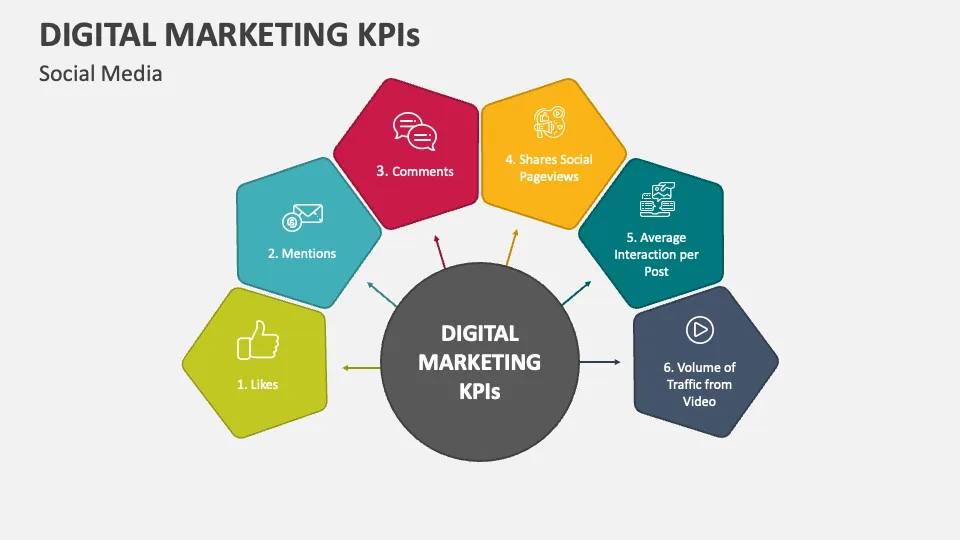
Track calls, direction requests, and booked appointments per location. Applying these principles to your key performance indicators in marketing yields measurable results. Comparing stores against each other often reveals operational issues that no central dashboard would surface.
Review volume and rating trends belong on the list too. For local search, reputation is a direct input to visibility, not a soft metric to admire from a distance.
Reporting Key Performance Indicators in Marketing to Executives
Executive attention is scarce, so your reporting has to earn it. Lead with the outcome, explain the driver, and state what you plan to do next. That structure works in almost any boardroom.
Skip the tour of every metric. Proper attention to your key performance indicators in marketing sets a strong baseline. Nobody wants a walkthrough of your dashboard. They want to know whether the business is on track and what you need from them.
One slide, three numbers, one ask. I have seen that format outperform a twenty-page deck more times than I can count.
Translating Marketing Into Business Language
Executives think in revenue, cost, and risk. Convert your indicators into those terms before you present.
Instead of “our click-through rate improved,” say “the same spend now produces more qualified conversations, which should add pipeline next quarter.” Same fact, better framing.
When you can, attach a range rather than a single figure. Forecasts presented as precise numbers invite arguments about decimals instead of decisions about direction.
Handling Bad News Well
Every program has rough months. The way you present a miss determines whether you keep trust or lose it.
Name the problem early, explain the cause, and bring a proposed fix. Developing your key performance indicators in marketing with precision highlights key strengths. Executives forgive setbacks; they do not forgive surprises that surface a quarter late.
Also, separate noise from signal. One soft week is not a trend. Show the longer view alongside the recent dip so the conversation stays grounded.
Tools and Technology for Tracking KPIs
You do not need an enterprise stack to run solid measurement. You need clean data, consistent definitions, and a place to look at it together.
Most teams get ninety percent of the value from an analytics platform, a CRM, and a spreadsheet. Clear alignment with your key performance indicators in marketing builds confidence from the start. Everything beyond that should solve a specific problem you can name.
Resist the urge to buy your way out of a process problem. A new tool applied to a broken workflow just produces faster confusion.
Analytics Platforms
Your web analytics tool handles traffic and on-site behavior. Make sure event tracking is set up deliberately rather than left to defaults.
Server-side tracking has become more common as browser restrictions tighten. Integrating key performance indicators in marketing into your workflow produces consistent quality. If a meaningful share of your conversions happens off-site, plan for it.
Whatever platform you choose, document what each event means. Future you, or the analyst who replaces you, will be grateful.
CRM and Revenue Attribution
Your CRM is where marketing meets revenue. Keep the handoff fields clean and enforce them, or your attribution will drift within weeks.
Require lead source, campaign, and qualification status on every record. It feels bureaucratic until the first time you need to prove marketing’s contribution to closed revenue.
Where possible, connect the CRM to your analytics so both systems tell the same story. Disconnected tools create the illusion of two different truths.
Dashboards and Visualization
Keep visualization simple. Line charts for trends, bar charts for comparisons, and single numbers for targets.
Color should signal status, not decorate. Green for on track, amber for watch, red for action needed. Anything more elaborate slows comprehension.
Finally, put the definition of each indicator in a tooltip or footnote. It prevents the meeting derailment that happens when two people interpret the same number differently.
Frequently Asked Questions About Key Performance Indicators in Marketing
These come up in almost every workshop I run, so here are direct answers.
What is the Difference Between a KPI and a Metric?
A metric is any measurable value. A KPI is a metric tied to a strategic objective with a target and a decision attached. All KPIs are metrics, but most metrics are not KPIs.
How Many KPIs Should a Marketing Team Track?
Three to five per team is a healthy ceiling. Beyond that, attention spreads thin and reporting becomes a chore instead of a tool.
Are Revenue and Profit Considered Marketing KPIs?
They are business outcomes that marketing contributes to, so they belong on a shared scorecard. Marketing should also track the leading indicators it directly controls.
How Often Should Key Performance Indicators in Marketing be Reviewed?
Match the cadence to the metric. Daily for spend and site health, weekly for pipeline and content, monthly and quarterly for strategy. Consistency matters more than frequency.
What if We Do Not Have Historical Data?
Measure for a full cycle before setting targets. A month of clean baseline data beats a guess that everyone quietly ignores.
Can Small Teams Run This Without Expensive Tools?
Absolutely. A spreadsheet, a well-configured analytics account, and disciplined definitions will carry a small team a long way.
How Do We Handle Attribution Disagreements?
Pick one model, document its weaknesses, and stay consistent. Add self-reported data to fill gaps, and revisit the model annually rather than mid-quarter.
Putting It All Together
Strong measurement is less about tools and more about discipline. Choose a few indicators that map to real objectives, define them clearly, and review them on a rhythm your team can sustain.
The teams that win with key performance indicators in marketing are not the ones with the fanciest dashboards. They are the ones who act on what they see, adjust quickly, and keep the whole organization pointed at the same handful of numbers.
Start small this week. Pick one objective, choose two indicators that predict it, and write down what you would do if each one moved. That single exercise will teach you more than another analytics subscription ever will.