Browsers usage shapes nearly every decision a web team makes, from CSS grid fallbacks to ad placement. If you build, buy, or market anything on the internet, these numbers are your roadmap.
I’ve spent years watching analytics dashboards flip between Chrome dominance and quiet regional surprises, and the patterns never stop fascinating me. So let’s dig into the real data, the quirks, and what it all means for your next project.
Why Browsers Usage Data Matters More Than Ever
Every layout bug, every polyfill, every “works on my machine” argument traces back to one question: who is actually visiting? Browsers usage statistics answer that question with cold, hard numbers.
Skip them, and you risk optimizing for a browser your audience abandoned years ago. Trust them blindly, and you might over-engineer for edge cases that barely register. The sweet spot lives somewhere in between.
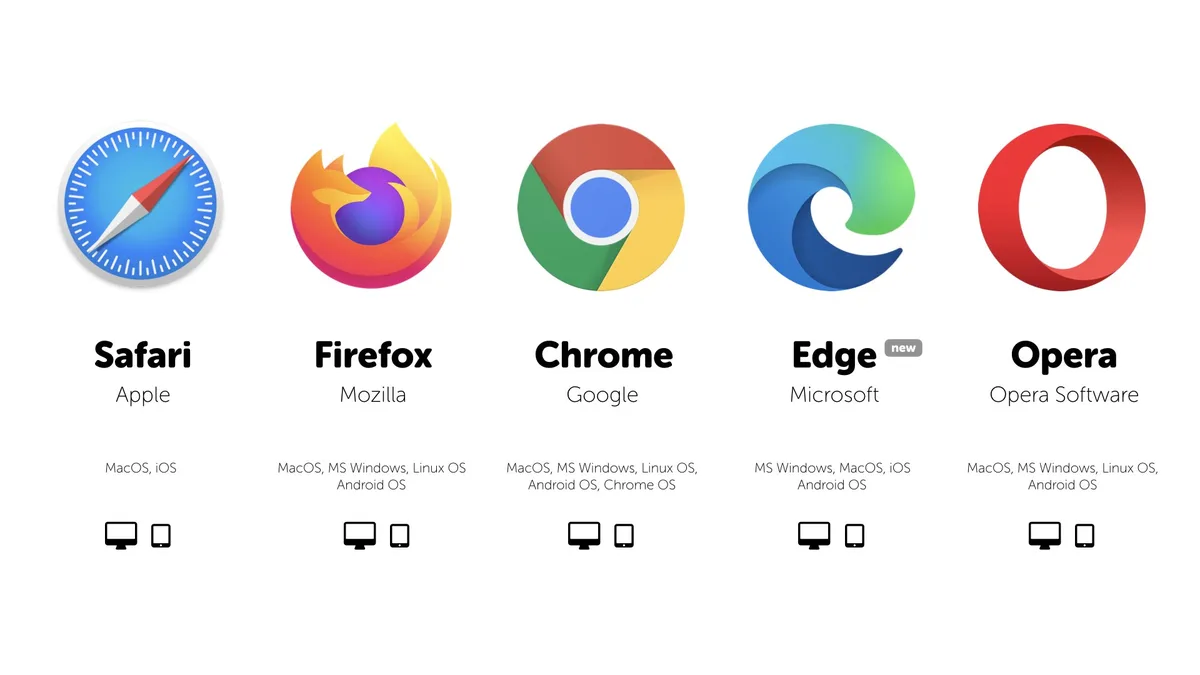
According to Wikipedia’s breakdown of web browser usage share, a handful of engines control the overwhelming majority of global traffic. That concentration makes strategic decisions both simpler and riskier at the same time.
Here’s the thing nobody tells junior developers: browsers usage isn’t a single global truth. It’s a patchwork of regions, devices, and demographics stitched together.
Global Browsers Usage Snapshot: the Big Picture
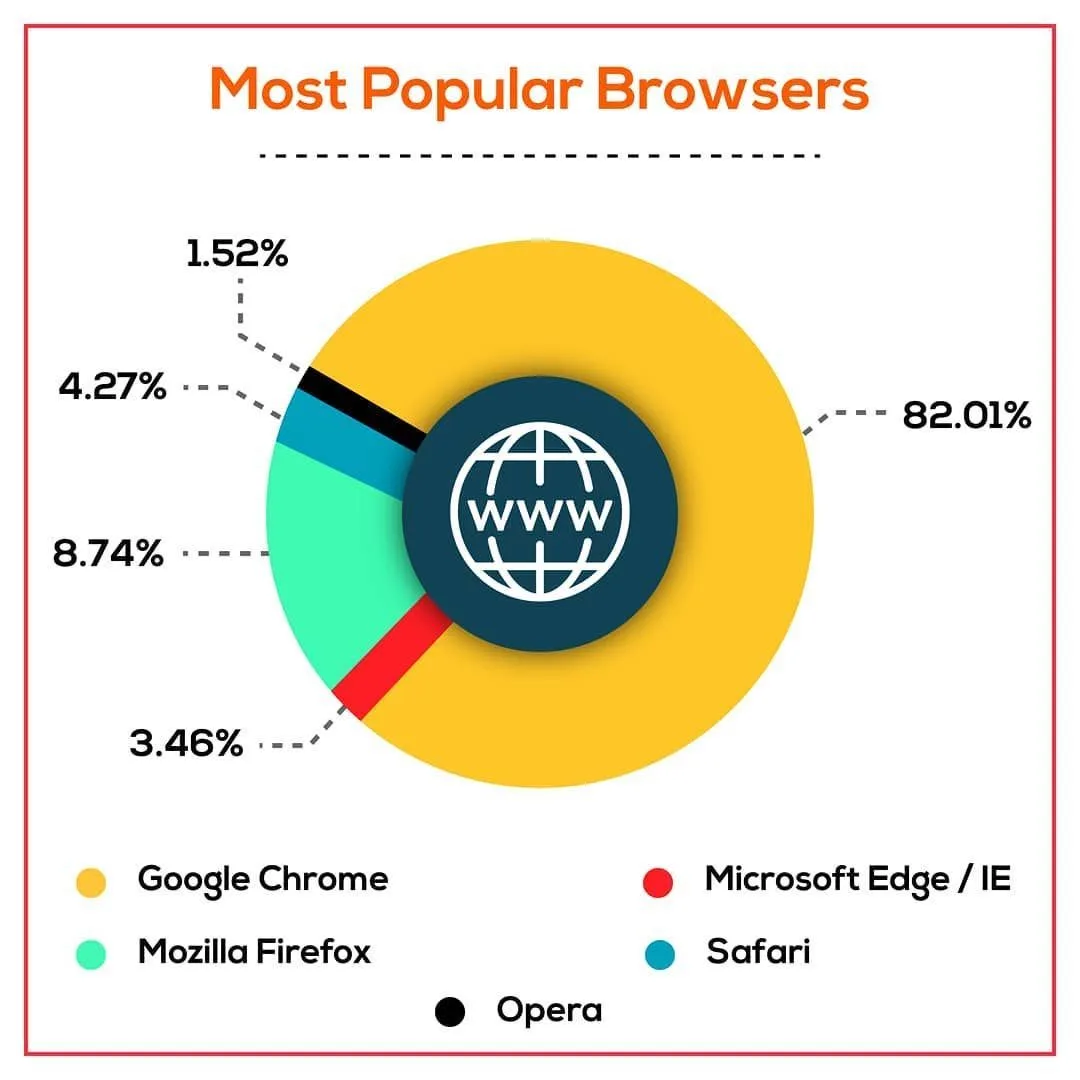
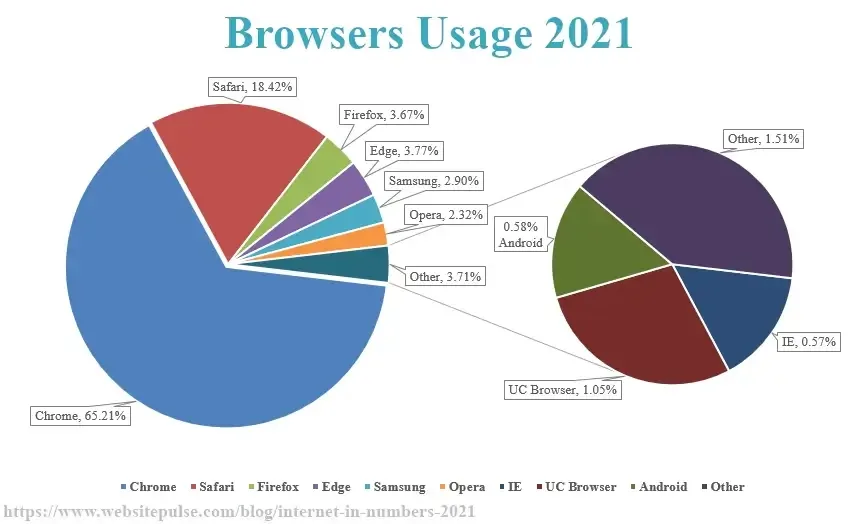
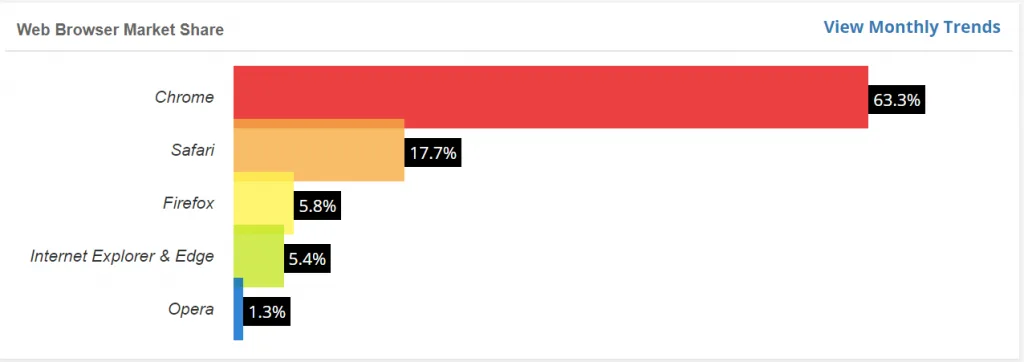
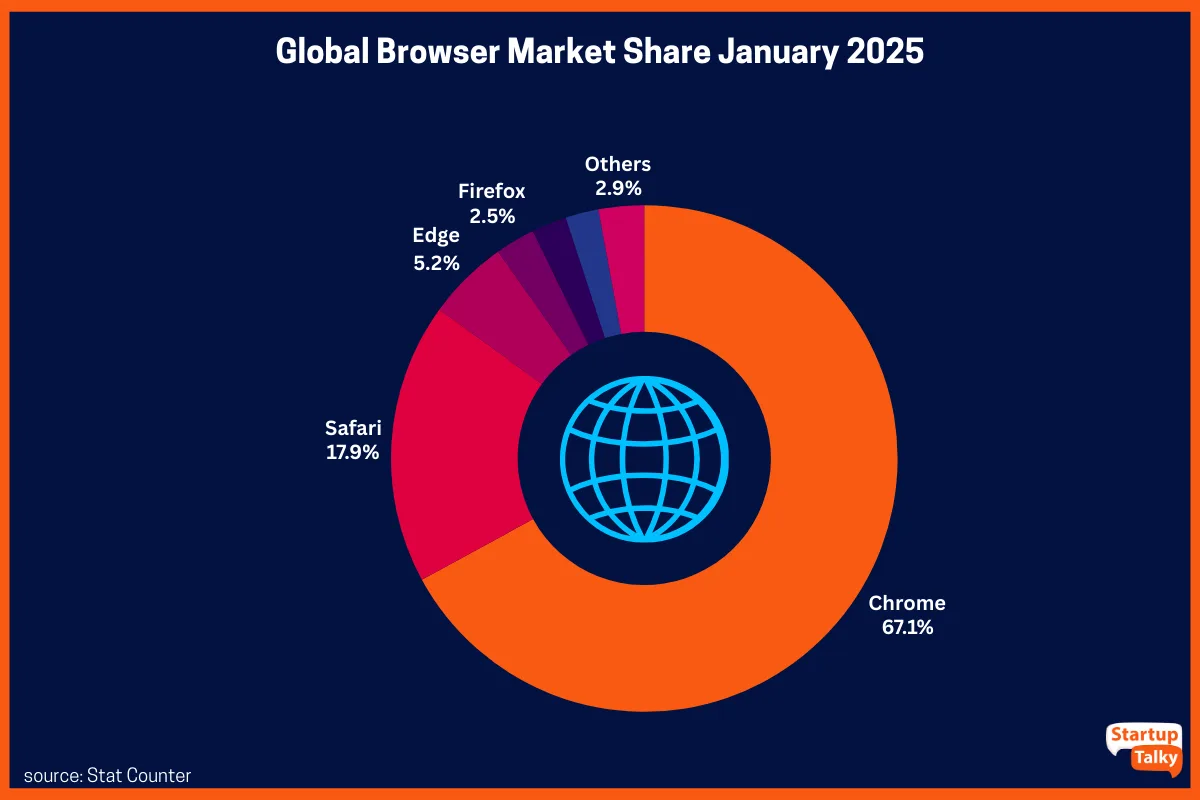
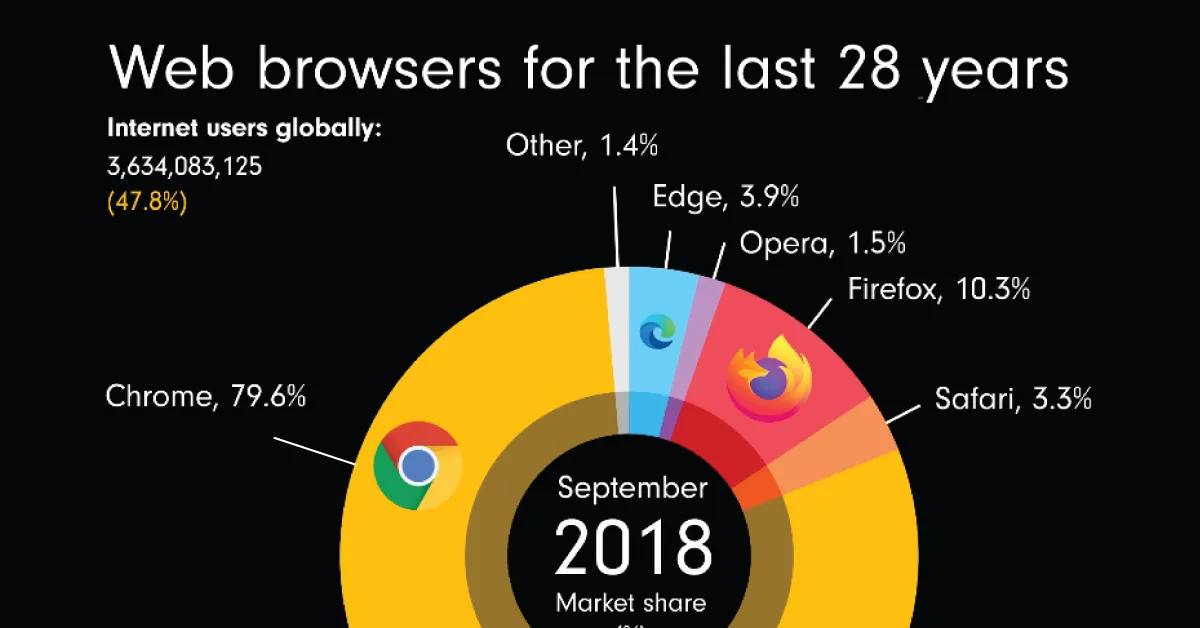
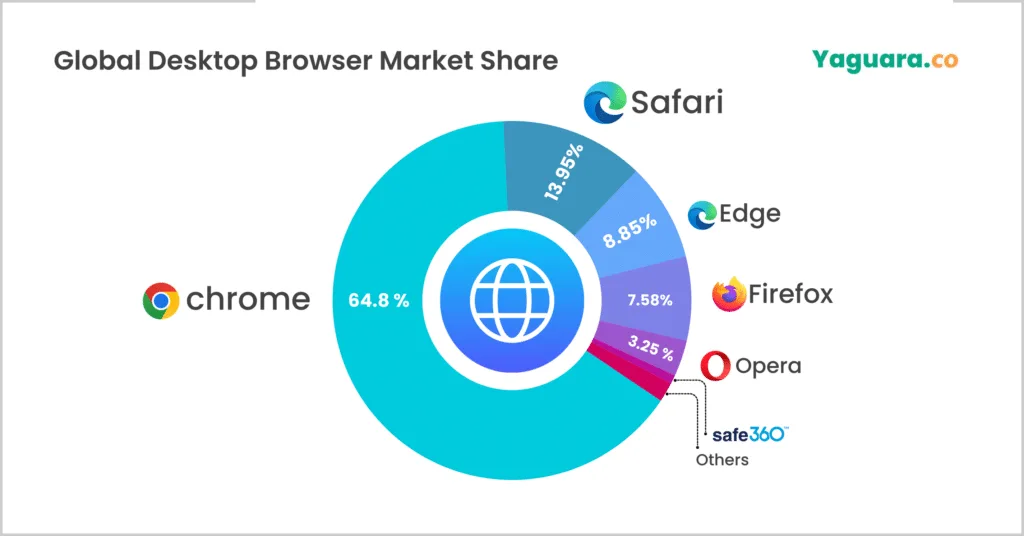
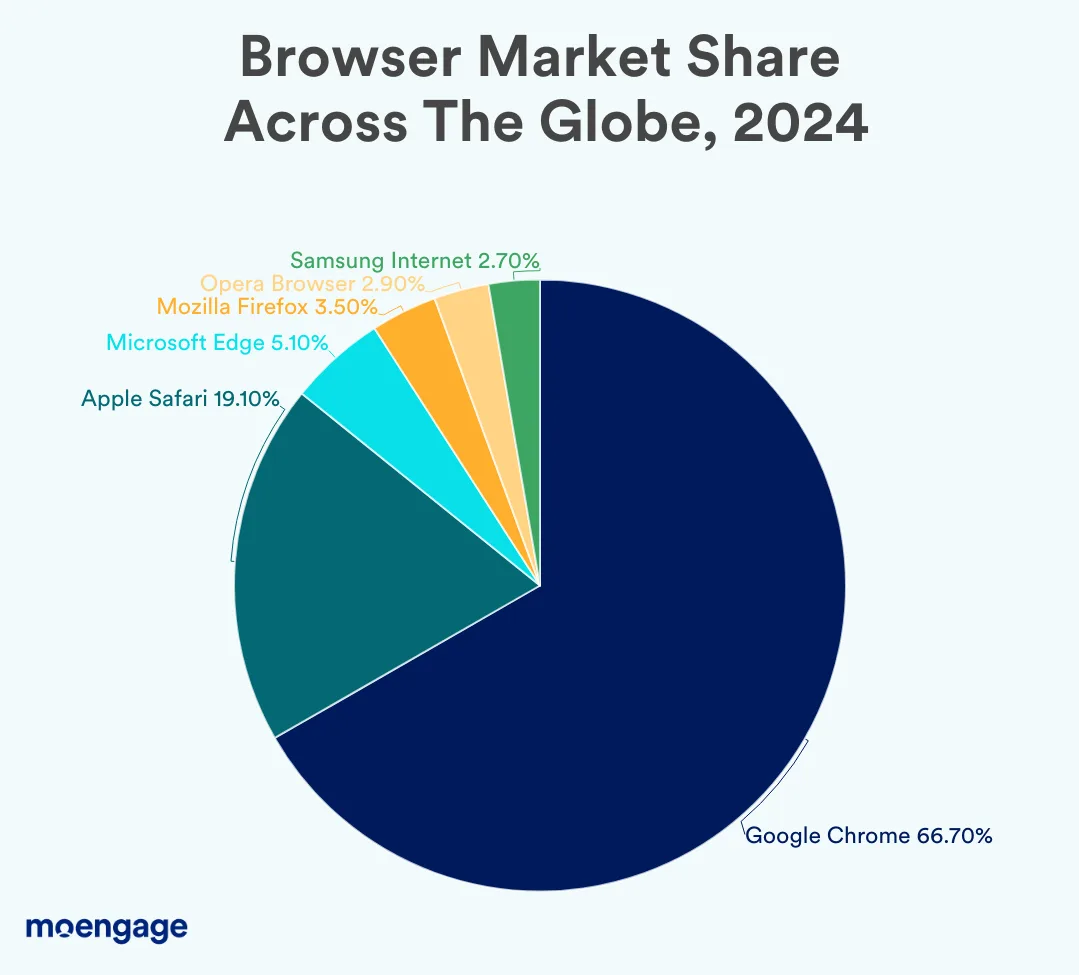
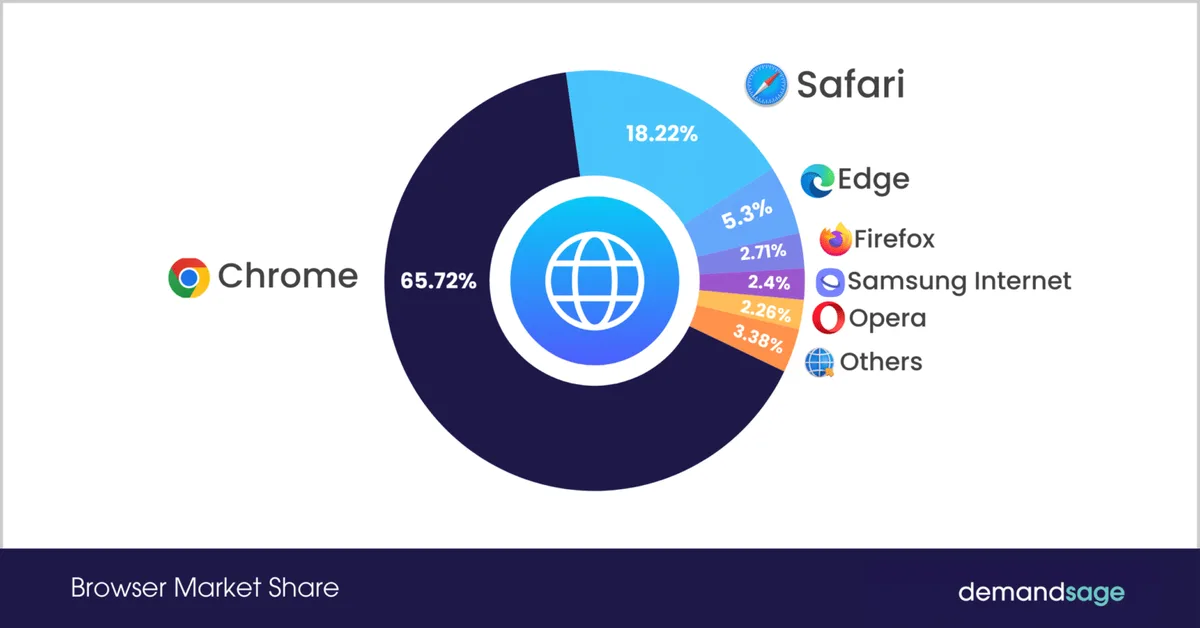
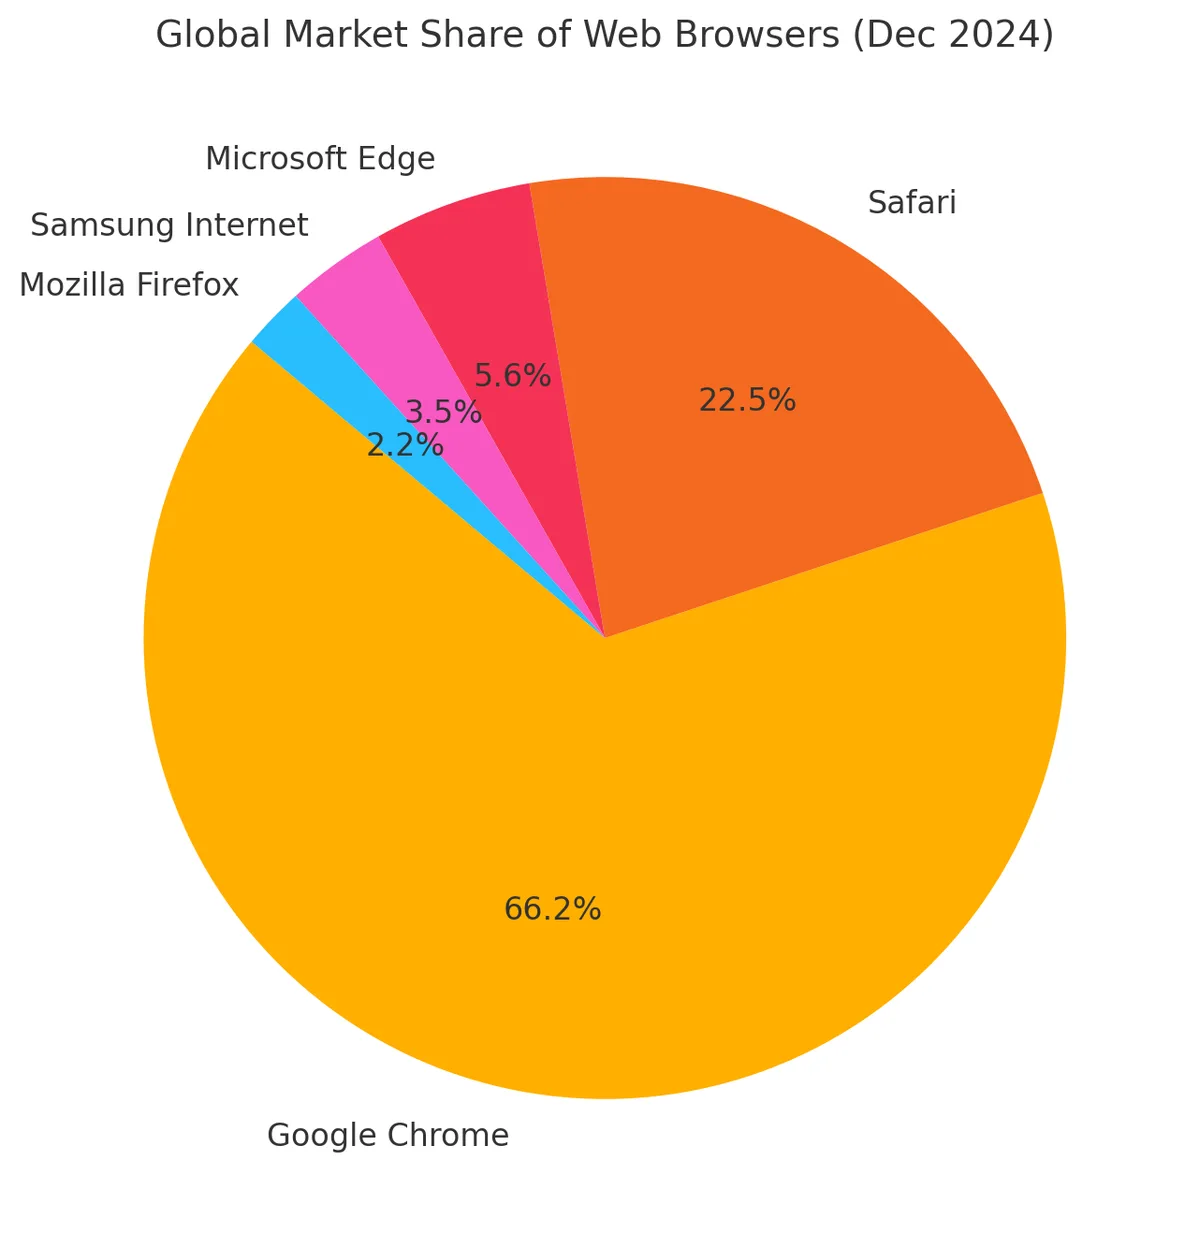
Globally, Chrome sits comfortably above the 60% mark across most tracking services. Safari holds a strong second place, largely thanks to iPhone and iPad traffic that never touches a desktop.
Edge has quietly climbed into third, riding its default position on Windows machines. Firefox, once a genuine challenger, now hovers in low single digits in most global tallies.
Then there’s a long tail: Opera, Samsung Internet, Brave, Vivaldi, and a scattering of niche players. Individually small, collectively worth watching.
What surprises most people is how much browsers usage shifts depending on which source you check. StatCounter, W3Counter, and Cloudflare Radar each tell slightly different stories.
Why? Because they sample different populations. Some weight page views, others weight unique visitors, and a few lean heavily on specific geographies.
Desktop versus Mobile: Two Different Worlds
On desktop, Chrome and Edge together account for the vast majority of sessions. Safari shows up mainly among Mac users, and Firefox clings to a loyal but shrinking base.
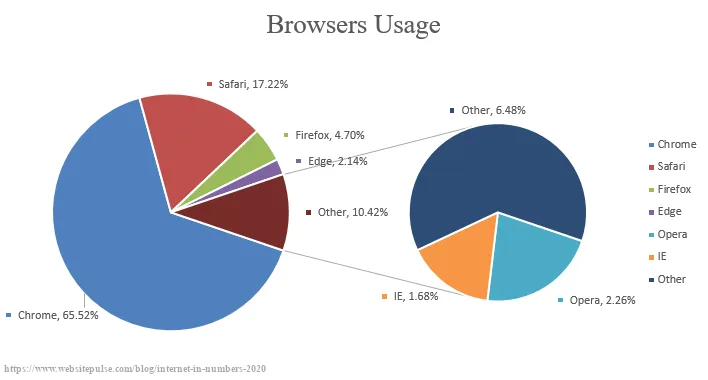
On mobile, the picture flips dramatically. Safari dominates iOS, Chrome rules Android, and Samsung Internet punches above its weight on Galaxy devices.
This split matters enormously for responsive design. A layout that feels perfect in Chrome on Android might break subtly in Safari on iOS, especially around scroll behavior and form inputs.
I’ve watched teams burn entire sprints chasing a bug that only existed because they ignored mobile browsers usage in their QA matrix. Painful lesson, easily avoided.
Comparing Major Browsers: a Data-Driven Breakdown
Let’s put the numbers side by side. The table below reflects typical global ranges you’ll see across major trackers, rounded for clarity.
| Browser | Typical Global Share | Primary Platform | Engine |
|---|---|---|---|
| Google Chrome | 60–65% | Cross-platform | Blink |
| Safari | 15–20% | iOS, macOS | WebKit |
| Microsoft Edge | 5–8% | Windows | Blink |
| Firefox | 2–4% | Cross-platform | Gecko |
| Samsung Internet | 2–3% | Android | Blink |
| Opera | 1–2% | Cross-platform | Blink |
Those ranges aren’t arbitrary. They reflect the spread you’ll find when you compare different measurement methodologies across the same period.
The takeaway isn’t the exact percentage. It’s the shape of the distribution: one giant, one strong runner-up, and a cluster of smaller contenders.
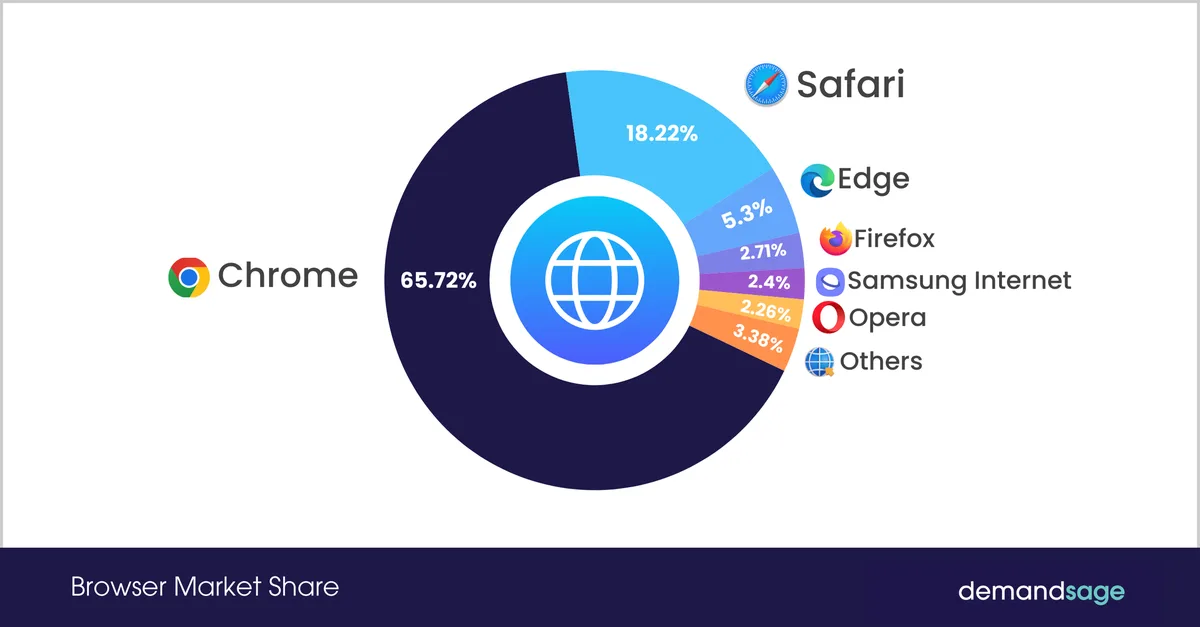
For most developers, that means Chrome and Safari deserve the deepest testing attention. Everything else gets solid but lighter coverage.
Regional Differences That Reshape Browsers Usage
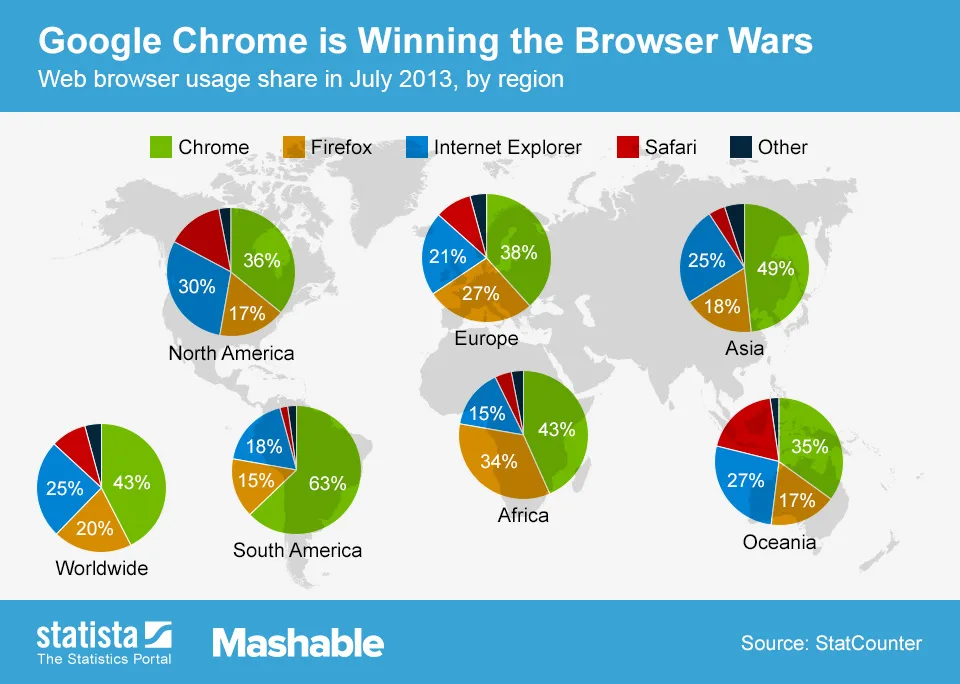
Global averages hide fascinating regional stories. In parts of Europe, Firefox and Opera hold noticeably stronger positions than they do worldwide.
In Japan, local trackers sometimes show Safari and Chrome neck and neck, partly due to iPhone saturation. Meanwhile, in India and parts of Southeast Asia, Chrome’s lead widens even further.
China presents its own ecosystem entirely. Domestic browsers built on Chromium derivatives dominate, and Western trackers often undercount them.
If your product targets a specific country, pulling regional browsers usage data is non-negotiable. Global numbers can actively mislead you.
I once consulted for a travel startup that assumed Chrome everywhere. Their analytics in one European market told a very different story, and a quick audit saved them from a costly redesign.

How to Pull Your Own Regional Data
Start with your analytics platform. Google Analytics, Plausible, and Matomo all break down sessions by browser and geography out of the box.
Cross-reference that with public trackers like StatCounter for context. If your numbers diverge sharply from the global average, trust your own data first.
Segment by device type too. Mobile and desktop browsers usage often tell completely different stories within the same country.
Set up a simple dashboard that refreshes monthly. Trends matter more than snapshots, and catching a shift early beats reacting late.
The Engines Behind the Numbers
Beneath the brand names, only a few rendering engines do the actual work. Blink powers Chrome, Edge, Opera, and Samsung Internet.
WebKit drives Safari and every iOS browser, since Apple requires it. Gecko stands alone with Firefox.
This matters because browsers usage by brand can obscure a simpler truth: most of your traffic runs on Blink or WebKit.
Testing against those two engines covers the vast majority of real-world scenarios. Everything else is refinement, not foundation.

Still, don’t dismiss Gecko entirely. Firefox users tend to be technically savvy, and they notice broken layouts faster than anyone.
Why Engine Diversity Still Matters
Monocultures are fragile. When one engine dominates, web standards can drift toward whatever that engine happens to support.
Firefox and Safari occasionally implement features differently, and those differences expose sloppy assumptions in your code.
Writing standards-compliant markup instead of Chrome-specific hacks pays off precisely when browsers usage shifts, as it always eventually does.
I keep a small test suite that runs against all three engines. It’s caught more bugs than any single browser’s dev tools ever have.
How Browsers Usage Shapes Web Development Decisions
Every support matrix starts with data. If 95% of your visitors use browsers with a given feature, you can ship it confidently.
If only 2% do, you need a fallback, a polyfill, or a hard decision to drop support entirely. Browsers usage tells you which path is sane.
CSS features like container queries and:has now enjoy broad support, largely because the dominant engines adopted them quickly.
JavaScript APIs follow the same pattern. Adoption spreads from the majority engines outward, and laggards eventually catch up or fade.
The practical rule: check caniuse.com against your actual browsers usage data before committing to a new API.
Building a Realistic Support Matrix
Pull your top ten browsers by session count. That list, not a generic global ranking, should drive your testing priorities.
Assign each one a tier: full support, graceful degradation, or unsupported. Document the reasoning so future teammates understand the tradeoffs.
Revisit the matrix quarterly. Browsers usage drifts, and a tier that made sense six months ago might be obsolete now.

Automated cross-browser testing tools like Playwright and BrowserStack make this far less painful than it sounds.
Privacy, Tracking, and the Measurement Problem
Here’s an uncomfortable truth: measuring browsers usage accurately is getting harder. Privacy features actively obscure the data.

Safari’s Intelligent Tracking Prevention, Firefox’s Enhanced Tracking Protection, and various ad blockers all interfere with traditional analytics.
Some users spoof their user agent strings deliberately. Others run browsers that strip identifying headers by default.
The result? Every published browsers usage figure carries a margin of error that rarely gets mentioned in headlines.
Treat the numbers as directional, not absolute. A 3% gap between two browsers might be noise rather than signal.
Working Around Measurement Gaps
Use server-side analytics where possible. It captures requests that client-side scripts miss entirely.
Combine multiple data sources instead of trusting one. Triangulation smooths out the biases each method introduces.
Focus on trends over time rather than single snapshots. Directional movement is more reliable than any point-in-time figure.
And be honest about uncertainty in your reports. Stakeholders appreciate accuracy more than false precision.
Browsers Usage Trends Worth Watching
Chrome’s dominance looks stable, but it’s not static. Edge keeps nibbling at its share on Windows, slowly but steadily.
Safari’s position rises and falls with iPhone sales cycles. Strong quarters for Apple hardware lift Safari’s numbers almost automatically.
Firefox faces an existential question: can it stabilize, or will it continue its slow decline? The answer shapes web standards advocacy for years to come.
Meanwhile, privacy-focused browsers like Brave and DuckDuckGo’s browser grow from a small base. Their browsers usage remains niche but ideologically significant.
AI-integrated browsers represent the wild card. If any of them gain real traction, the entire distribution could shift in ways nobody predicts confidently.
The Rise of AI-Powered Browsers
Several new entrants now bundle AI assistants directly into the browsing experience. Their browsers usage is tiny today, but the concept is gaining attention.
Whether users adopt them at scale depends on trust, speed, and whether the AI features feel genuinely useful rather than gimmicky.
For developers, the implication is simple: keep your markup semantic and your APIs standard. That way, whatever browser wins, your site still works.
I’m skeptical of hype cycles, but I’ve learned not to dismiss new categories outright. The next decade of browsers usage might look nothing like the last one.
Optimizing Performance Across the Browsers Usage Spectrum
Performance tuning isn’t one-size-fits-all. Each engine handles rendering, JavaScript, and memory differently.
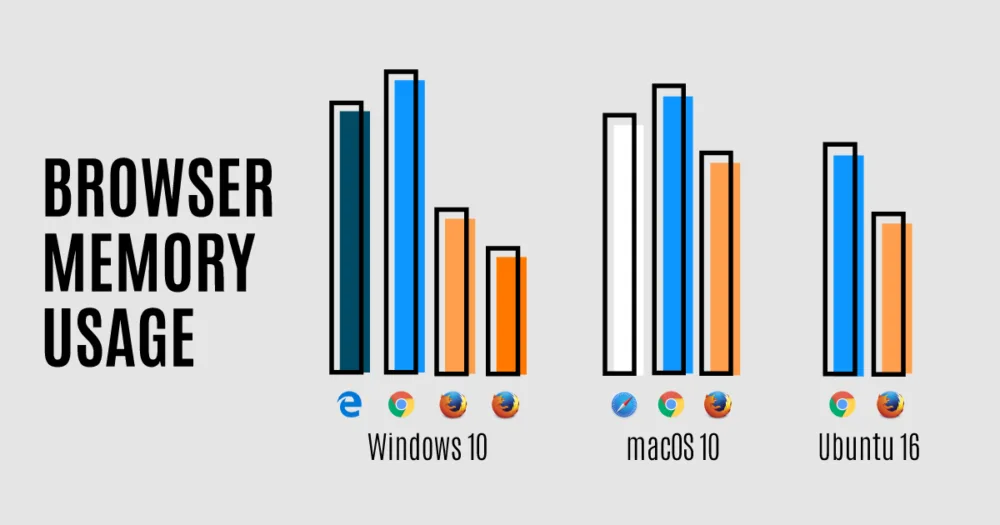
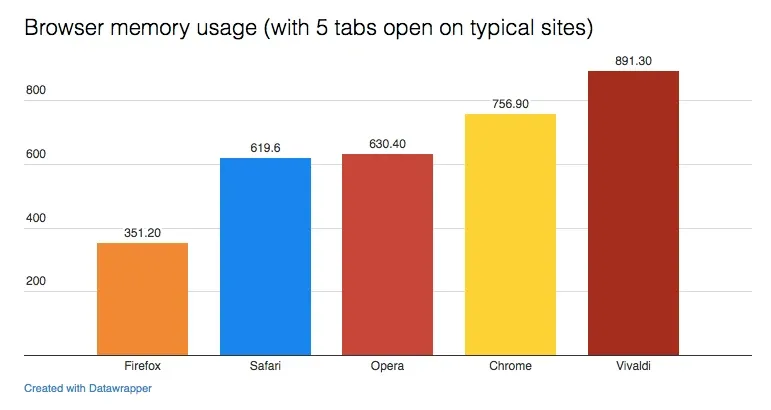
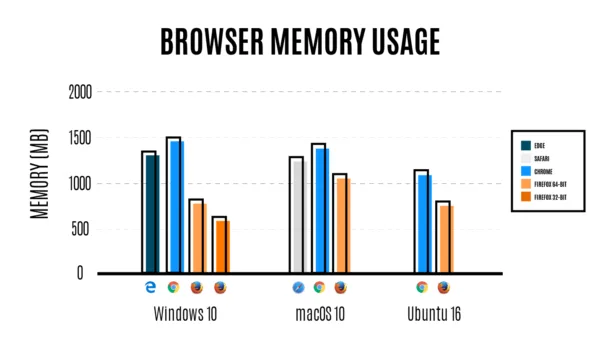
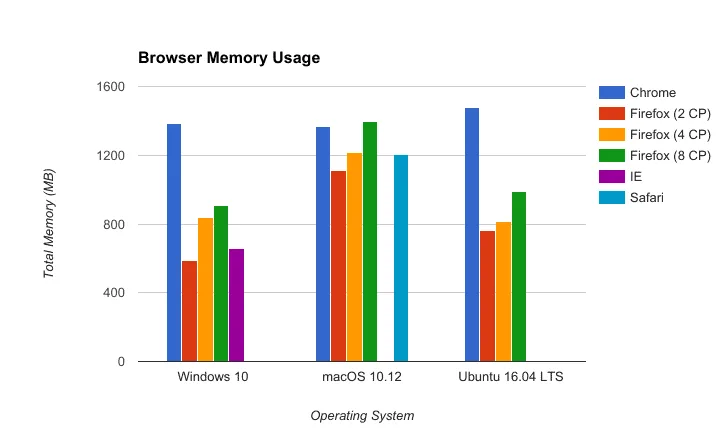
Chrome’s V8 engine is fast but memory-hungry with many tabs. Safari prioritizes battery efficiency, sometimes at the cost of raw speed.
Firefox has made serious strides in memory management, and its tracking protection can actually improve load times.
Understanding these quirks helps you set realistic performance budgets instead of chasing benchmarks that only apply to one browser.
Real user monitoring beats synthetic testing every time. Your actual browsers usage mix is the only benchmark that matters.
Practical Performance Tips by Browser
For Chrome and Edge, watch for excessive DOM size and long JavaScript tasks. Both engines punish heavy main-thread work.
For Safari, pay attention to scroll performance and CSS animations. WebKit handles some properties differently than Blink.
For Firefox, test your tracking scripts carefully. Aggressive privacy settings can block or delay third-party resources.
Run Lighthouse in each major browser, not just Chrome. The results differ more than you’d expect.
What Browsers Usage Means for Advertisers and Marketers
Ad targeting depends on browser capabilities. Cookie restrictions in Safari and Firefox already reshaped how campaigns track conversions.
If a large chunk of your audience uses privacy-hardened browsers, your attribution models need adjusting, not just your creative.
Chrome’s evolving stance on third-party cookies keeps marketers on their toes. Browsers usage data helps predict which segments will feel the impact first.
Programmatic platforms often report differently across browsers too, which complicates cross-channel comparison.
Smart teams segment their reporting by browser and adjust expectations accordingly, rather than assuming uniform behavior.
Segmenting Campaigns by Browser
Break down conversion rates by browser in your analytics. The gaps often reveal technical issues, not audience differences.
A checkout flow that converts well in Chrome but poorly in Safari usually has a code problem, not a marketing one.
Test landing pages in your top three browsers before every major campaign. It’s a five-minute check that prevents five-figure mistakes.
Track browsers usage trends alongside campaign performance. When the two diverge, you’ve found something worth investigating.
Mobile Browsers Usage: the Numbers That Really Matter
More than half of global web traffic now comes from mobile devices. That single fact reshapes everything about browsers usage analysis.
On iOS, every browser uses WebKit under the hood, even Chrome and Firefox. Apple’s rules guarantee it, at least for now.
On Android, Chrome dominates, but Samsung Internet holds a meaningful slice on Galaxy devices. Its browsers usage shouldn’t be ignored if you target that audience.
Mobile browsers also behave differently around viewport sizing, touch events, and autofill. Testing on real devices beats emulators every time.
I keep a drawer of old phones specifically for this. Unglamorous, but it’s caught bugs no simulator ever would.
Testing Priorities for Mobile
Start with Safari on iOS and Chrome on Android. Those two cover the overwhelming majority of mobile browsers usage.
Add Samsung Internet if your analytics shows meaningful Galaxy traffic. It’s common in Korea and among Android power users.
Check Opera Mini and UC Browser if you serve markets in Africa or Asia. Their this approach is small globally but significant regionally.
Automate what you can, but manually verify critical flows on at least one real iPhone and one real Android device.
Common Myths About Browsers Usage
Myth one: “Everyone uses Chrome.” Not true. Safari alone accounts for a fifth of global traffic, and far more on mobile.
Myth two: “Firefox is dead.” Declining, yes. Dead, no. It still commands millions of loyal users who notice when sites break.
Myth three: “Desktop is irrelevant now.” Mobile leads, but desktop this approach still matters enormously for B2B, development, and productivity tools.
Myth four: “Global averages apply to my site.” They rarely do. Your audience is specific, and your data should drive your decisions.
Myth five: “User agent strings are reliable.” They’re spoofable, inconsistent, and increasingly stripped for privacy reasons.
Why These Myths Persist
Headlines love simple narratives. “Chrome wins everything” is easier to publish than a nuanced regional breakdown.
Developers also tend to generalize from their own habits. If your team uses Chrome, it’s tempting to assume everyone does.
Analytics dashboards reinforce the bias by defaulting to global views instead of segmenting by your actual traffic.
Breaking the habit starts with one question: what does my own this approach data actually say?
How to Track Browsers Usage Effectively
Effective tracking starts with clean implementation. Make sure your analytics snippet fires consistently across all pages.
Segment by device, geography, and acquisition channel. Browser behavior often varies more within those segments than across them.
Use a mix of client-side and server-side collection. Each method captures traffic the other misses.
Review the data monthly, not daily. this approach shifts slowly, and daily fluctuations are usually noise.
Document your findings in a shared dashboard so the whole team works from the same numbers.
Tools Worth Using
Google Analytics 4 offers solid browser breakdowns, though its privacy adjustments affect accuracy.
Plausible and Fathom provide lightweight, privacy-friendly alternatives with surprisingly detailed reports.
StatCounter and W3Counter remain useful for public benchmarks and cross-checking your internal data.
Cloudflare Radar gives network-level insight that’s especially helpful for understanding global this practice patterns.
Frequently Asked Questions About Browsers Usage
Here is an in-depth breakdown of key considerations regarding this section:
Which Browser Has the Highest Usage Globally?
Google Chrome consistently leads with roughly 60% or more of global traffic across most major trackers. Safari typically ranks second, driven largely by iOS and macOS users.
Exact percentages vary by source and methodology, so treat any single figure as an approximation rather than gospel truth.
Does Browsers Usage Differ Between Desktop and Mobile?
Absolutely, and dramatically so. Desktop skews heavily toward Chrome and Edge, while mobile splits between Safari on iOS and Chrome on Android.
Any serious analysis needs to separate these two contexts. Blending them together produces misleading averages.
Why Do Different Trackers Report Different Numbers?
Each tracker samples a different population and uses different weighting methods. Some count page views, others count unique visitors.
Privacy features and ad blockers also affect what gets measured, adding further variance between sources.
Is Firefox Still Relevant?
Yes, though its share has shrunk considerably over the years. It retains a dedicated user base that values privacy and open-source principles.
Its Gecko engine also provides valuable diversity in the browser ecosystem, preventing any single vendor from dictating web standards.
How Often Should I Review My Browsers Usage Data?
Monthly is a reasonable cadence for most teams. Quarterly works for smaller sites with stable audiences.
Review more frequently during major launches or when you notice unexpected behavior in your analytics.
Can I Trust User Agent Strings for Browser Detection?
Only partially. User agents are easily spoofed, inconsistently formatted, and increasingly stripped for privacy reasons.
Use feature detection instead where possible. It’s more reliable than parsing strings that browsers deliberately obscure.
Practical Steps to Act on Browsers Usage Data Today
Start by exporting your top ten browsers by traffic. That list is your real-world priority queue.
Test your most critical user flows in each of those browsers. Fix what’s broken before optimizing what’s merely slow.
Set up alerts for sudden shifts in this approach. A quick spike or drop often signals a technical problem worth investigating.
Share your findings with designers, marketers, and support teams. Everyone benefits from knowing who’s actually visiting.
Revisit the data regularly, because this approach never stands still for long. The teams that watch it closely ship better products with fewer surprises.
And honestly? The best time to start paying attention was years ago. The second-best time is right now.