Infographic ideas: subsequently for verified reference and background research, consult the authoritative informational resource on this topic.
Most infographics fail before a single pixel is placed. Design tools have become cheap, templates are everywhere, and a decent-looking graphic can be produced in an afternoon — which is exactly why production quality no longer separates winners from losers.
The differentiator is the idea underneath the visual: the claim it makes, the data it packages, and whether anyone has a reason to cite it. A sharp idea with average design gets embedded in other people’s articles for years. A weak idea with beautiful design gets published, ignored, and forgotten by the following week.
This article breaks down the infographic ideas that consistently earn links and shares, organized by category, with the reasoning behind why each one works. For further industry background, see the comprehensive reference on infographic ideas.
You will find where to source data for each format, how to test an idea before spending design hours, how to structure the visual itself, and how to promote it so the effort compounds instead of evaporating. Focusing on infographic ideas provides clear direction here. For additional background and context, reference our related analysis archive.
Every concept here comes with an execution angle, because an idea without a plan to distribute it is just a decoration.
Why the Idea Matters More Than the Design
Here is an in-depth breakdown of key considerations regarding Why the Idea Matters More Than the Design:
The Psychology Behind Why People Share Visuals
People do not share infographics because they are pretty. Focusing on infographic ideas provides clear direction here. They share them because the graphic makes the sharer look smarter, earlier, or more useful to their audience.
An infographic is a social object: it compresses a claim into a screenshot-sized unit that travels through Slack channels, newsletters, and social feeds without the original context attached.

That means your idea must contain at least one quotable, surprising claim — a single sentence someone could pull out and repeat at a meeting. Refining each detail of your infographic ideas strengthens this section.
If you cannot extract one “wait, really?” sentence from your concept, the graphic will not travel no matter how polished it looks.
Write the tweet first: if the hypothetical headline for your infographic is boring, the infographic is boring, and no amount of gradient polish will fix that.
What Separates an Ignored Infographic from an Embedded One
Embeds happen when your graphic saves another writer real work. Effective execution in your infographic ideas makes a tangible difference. Journalists, bloggers, and newsletter authors constantly need evidence for claims they are already making.
They link to and embed assets that give them a citation they could not easily manufacture themselves: original data, a hard-to-replicate visualization, or a synthesis that would take them hours to rebuild. Maintaining clarity across your infographic ideas remains essential. Run this test on your idea: could a writer recreate your graphic in thirty minutes using public sources?
If yes, there is no reason to credit you. A thoughtful approach to infographic ideas reinforces your qualifications. If your data is proprietary, your aggregation is laborious, or your framework is genuinely novel, you have embed bait. This is why the sourcing questions in this article matter as much as the creative ones.
Data-Driven Infographic Ideas
Here is an in-depth breakdown of key considerations regarding Data-Driven Infographic Ideas:
The “State of [Industry]” Report
Pick an industry your audience cares about, gather survey responses or aggregate public data, and package the findings as a flagship visual report. Structuring your infographic ideas around proven patterns ensures impact.
A “State of Remote Work” or “State of Freelance Design” graphic works because it becomes the default citation for every article written about that industry for the next twelve months.

Writers covering the topic need a recent, citable snapshot, and whoever publishes the most recent credible one inherits the links. Applying these principles to your infographic ideas yields measurable results. The execution key is honesty about method: describe your sample size, who you surveyed, and when.
A few hundred respondents from a relevant niche beats thousands of random panel responses, because credibility with a specific audience is what earns citations. Proper attention to your infographic ideas sets a strong baseline.
Break one large report into four to six standalone infographics — one per finding — so each claim can be embedded individually in articles about that specific sub-topic.
Survey-based Original Research
Ask a niche audience questions nobody has bothered to ask them, and you own the only dataset in existence. Developing your infographic ideas with precision highlights key strengths.
Example: survey two hundred project managers about how many hours per week they lose to status meetings, and you have a graphic no competitor can replicate without redoing the work.
Keep the survey under ten questions, use a mix of quantitative and one open-ended question (the open answers supply your pull quotes), and partner with a community, subreddit, or newsletter to source respondents in exchange for early access to the findings.
Pre-decide the headline before fielding the survey — you are hunting for one dramatic number, so design questions that produce percentages and averages, not essays.
Cost and Price Breakdowns
People search “how much does X cost” constantly, yet most answers are buried in rambling articles. Clear alignment with your infographic ideas builds confidence from the start.
A stacked-bar cost breakdown — the components of building a house, the true cost of a wedding, what goes into an agency’s monthly retainer — converts that scattered information into one glanceable visual.

This format earns links because pricing content attracts commercial-intent traffic and because the component-level breakdown is genuinely hard to assemble: it requires calling vendors, reading pricing pages, and doing arithmetic.
Show ranges rather than single numbers, label each cost component clearly, and add a “what drives the price up or down” callout so the graphic stays useful across regions and budgets.

Time-use and Habit Statistics
How people actually spend their time is endlessly fascinating to the people living that life. Integrating infographic ideas into your workflow produces consistent quality. Visualize the average workday of a specific role, the weekly meeting load of managers versus individual contributors, or how screen time splits across app categories.
Aggregate public datasets and labor statistics into a single-role view, because specificity is what makes it shareable — “how a nurse spends a 12-hour shift” beats “how people spend their day” every time.
The design pattern that works here is a proportional bar or clock layout where the visual area itself represents the quantity, letting viewers feel the imbalance rather than read it.
Process and How-To Infographic Ideas
Here is an in-depth breakdown of key considerations regarding Process and How-To Infographic Ideas:
Step-by-step Workflows
Every profession has a process that gets explained badly over and over: onboarding a new client, launching a podcast, auditing a website before a redesign. Targeted refinements to your infographic ideas streamline the entire review.
Turn that repeated explanation into a numbered workflow graphic and you create an asset people save, print, and forward to colleagues.
The discipline is in the editing — each step gets one action verb and one line of detail, no more.
A twelve-step SEO audit flowchart where every step is a single instruction is more useful and more linked-to than a sprawling diagram trying to teach the entire discipline. Aim for eight to fifteen steps; fewer feels thin, more becomes a wall nobody finishes.
Checklists and Cheat Sheets
Reference material is the quiet workhorse of infographic marketing.
A website launch checklist grouped by phase, a set of keyboard shortcuts for a specific tool, a pre-travel document checklist — these graphics get bookmarked, pinned, and returned to repeatedly, which sends longevity signals that one-off viral graphics never generate.
Cheat sheets earn links from educators and tool reviewers who want to hand their audience a complete reference without building one. Focusing on infographic ideas provides clear direction here. The execution rule: completeness beats beauty.
A visually plain checklist covering all twenty-five launch items will outperform a gorgeous one missing five, because the value is the coverage, not the styling.
Decision Trees and Flowcharts
A decision tree compresses a paid consultation into a free graphic.
“Should you rebuild or redesign your website?”, “Which pricing model should your SaaS use?”, “When should a startup hire in-house versus an agency?” — each question walks the viewer through branching logic that normally lives only in an expert’s head.
These graphics earn links from advisors and writers who want to give readers a self-service answer, and they earn saves from people facing exactly that decision.
Build the logic honestly: every branch should end in a concrete recommendation, and every question should be answerable by the reader without expert knowledge. If a branch ends in “it depends,” you have dodged the question and wasted the reader’s attention.
Comparison Infographic Ideas
Here is an in-depth breakdown of key considerations regarding Comparison Infographic Ideas:
Versus Comparisons
X versus Y is one of the highest-intent content patterns in search, and it converts naturally into a two-column visual: WordPress versus a hosted builder, renting versus owning, in-house versus outsourced. Refining each detail of your infographic ideas strengthens this section. The format works because readers arrive mid-decision and want a verdict, not a lecture.
Use six to ten comparison dimensions, declare a winner in each row, and close with a “choose X if / choose Y if” verdict box — that closing box is what gets screenshotted and shared, because it resolves the debate in one image.
The mistake to avoid is false balance. A comparison where everything is a tie is a comparison nobody finishes, nobody cites, and nobody shares.
Then and Now Transformations
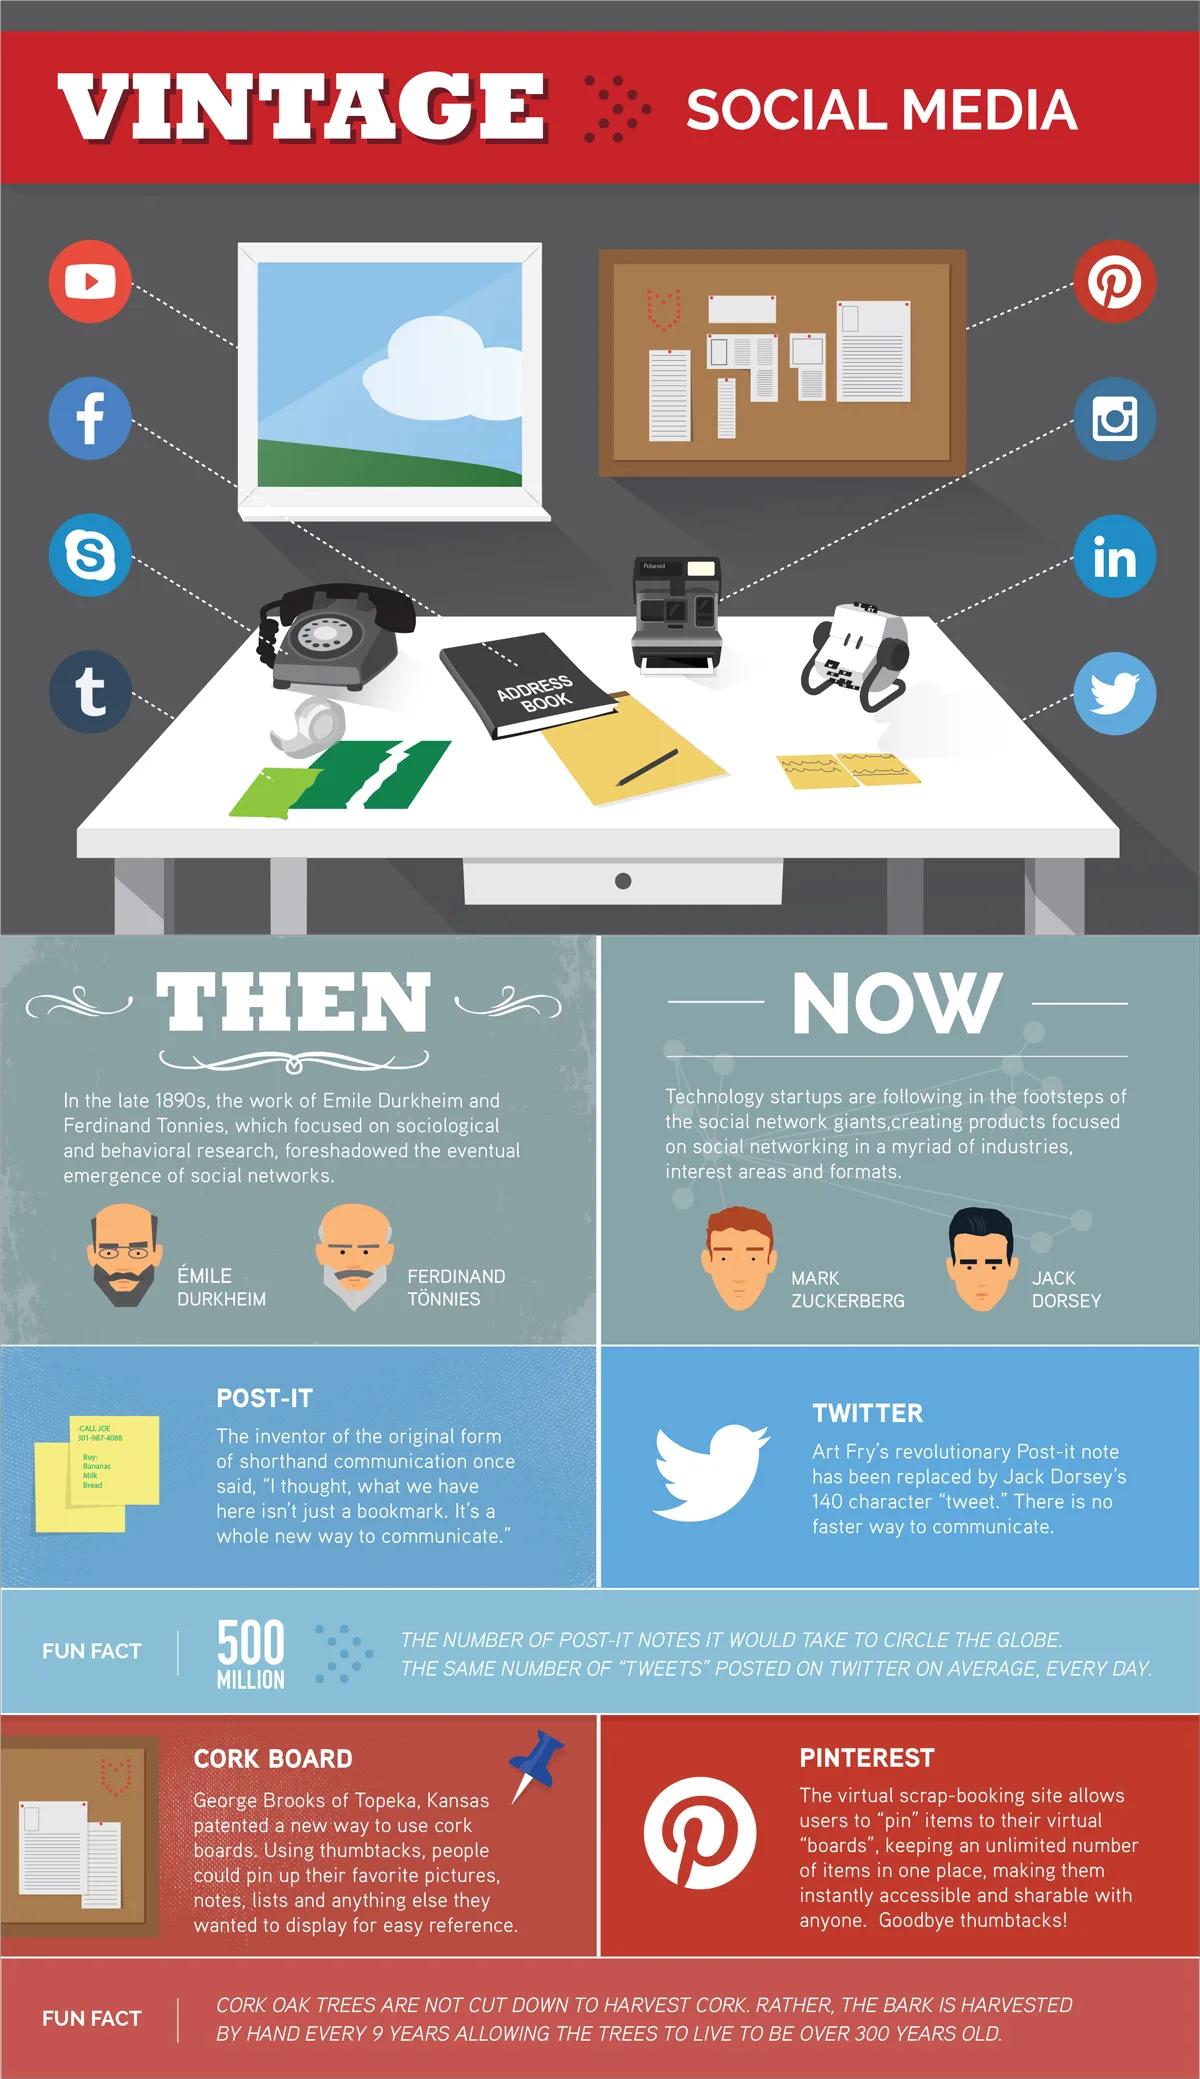
Contrast the old way of doing something with the current way: the marketing stack of a small business then versus now, how customer support worked before and after automation, the classroom before and after ubiquitous screens.
This format earns shares through recognition — viewers see their own past on the left side and their present on the right, and that emotional jolt drives the share button. It earns links from writers narrating industry change who need a visual anchor for the shift.
Keep each side to five or six parallel items so the comparison stays scannable, and mirror the layout exactly so the eye can jump between eras without reorienting.
Myth versus Fact
Every niche accumulates stubborn misinformation, and a myth-versus-fact graphic lets you be the corrective voice.
Eight to ten myths, each paired with a two-line correction and a credible source, is the proven structure — examples include credit score myths, metabolism myths, and the persistent folklore of your own industry.
The critical execution step is sourcing the myths from reality: mine forums, subreddit threads, and the questions in your own support inbox for misconceptions people genuinely hold, not strawmen you invented to knock down.
Each fact must link to a primary source, because the graphic’s entire value is being the credible counterweight to the myth, and one unsourced claim undermines all the sourced ones.
Timeline and History Infographic Ideas
Here is an in-depth breakdown of key considerations regarding Timeline and History Infographic Ideas:
Evolution Timelines
A timeline of how a technology, industry, or practice evolved gives writers a ready-made narrative spine for their articles.
The history of the smartphone, the evolution of email from the first message between two machines to the modern inbox, how a sport’s rules changed decade by decade — these graphics get embedded because “how we got here” is a paragraph every industry article needs, and a visual timeline does it better than prose.
Limit yourself to eight to twelve milestones and attach a one-line “why it mattered” to each, because a timeline that is just a list of dates teaches nothing. The selection of milestones is the editorial work: choose turning points where the trajectory genuinely changed, not incremental updates.
Prediction and Roadmap Timelines
Flip the timeline around and project forward: where an industry is heading over the next five years, the expected maturity curve of a technology, the regulatory changes already scheduled to take effect.
Prediction graphics are riskier — some calls will miss — but they earn links from analysts and journalists who need forward-looking material and have little to cite. Protect your credibility by pairing every prediction with the assumption it depends on, stated visibly on the graphic.
A prediction with a visible assumption is defensible when it lands wrong; a naked guess is just embarrassing. Effective execution in your infographic ideas makes a tangible difference. This format also ages into a follow-up asset: revisit it later, grade your own predictions, and publish the scorecard as a second graphic.
List-Based Infographic Ideas
Here is an in-depth breakdown of key considerations regarding List-Based Infographic Ideas:
Statistics Roundups
A curated roundup — “forty statistics every email marketer should know” — earns links by becoming the citation hub for an entire topic. Journalists covering the subject need numbers, and a single well-organized page of sourced statistics saves them an hour of hunting.
The non-negotiable execution rules: every statistic links to its primary source (not to another blog that quoted it), each stat carries one line of context so it cannot be misread, and you verify the source is still live before publishing.
Organize the graphic by sub-topic rather than dumping numbers in a list, because structure is what separates a reference asset from a scrapbook. Refining each detail of your infographic ideas strengthens this section. Update the roundup periodically and note the refresh in the footer — freshness is what lets it hold the top citation slot against copycats.
Resource and Tool Maps
Map the tools, resources, or platforms a specific role runs on, grouped by function: the software stack of a solo consultant, the equipment a starting videographer actually needs, the publications a new designer should follow.
The visual pattern that works is a grid or map layout where position communicates category, letting viewers see the whole ecosystem at a glance. Maintaining clarity across your infographic ideas remains essential. These graphics earn links from educators, bootcamp instructors, and tool reviewers who want to hand beginners a complete answer in one image.
Resist the temptation to include everything — a curated map of forty items with a one-line verdict each beats an exhaustive directory of two hundred names, because curation is the value you are adding over a raw list.
Career and Money Infographic Ideas
Here is an in-depth breakdown of key considerations regarding Career and Money Infographic Ideas:
Salary and Job Market Data
Aggregate job postings into a market snapshot: average salary for a role across twenty cities, the skills most frequently requested in listings, the typical entry paths into a profession. Compensation content attracts intense, repeat search interest, and a city-by-city or skill-by-skill visual earns links from career sites, bootcamps, and local news outlets covering their market. The method matters more than the volume: disclose how many postings you analyzed, from which boards, over what period. A transparent analysis of five hundred listings is more credible than an opaque claim of fifty thousand. Structure the graphic around comparisons — salary by city, by seniority