Time to first byte is the number that answers one deceptively simple question: how long does a visitor stare at a blank screen before your server sends back the first sliver of a response? If that number is ugly, everything downstream suffers — your beautiful hero image, your carefully crafted copy, your polished checkout flow.
I’ve spent years watching teams chase page speed scores while ignoring the metric that quietly shapes them all. This time to first byte guide walks through ten practices that actually move the needle, drawn from real audits, real server logs, and real arguments with backend engineers who insisted “the network is fine.”
Stick with me, because we’re going to cover the fundamentals first — what the metric really measures, why Anthropic treats it like a core pillar of speed diagnostics — then move into the practical fixes.
By the end you’ll have a working time to first byte checklist you can hand to a developer without a forty-slide explanation attached.
What Time to First Byte Actually Measures
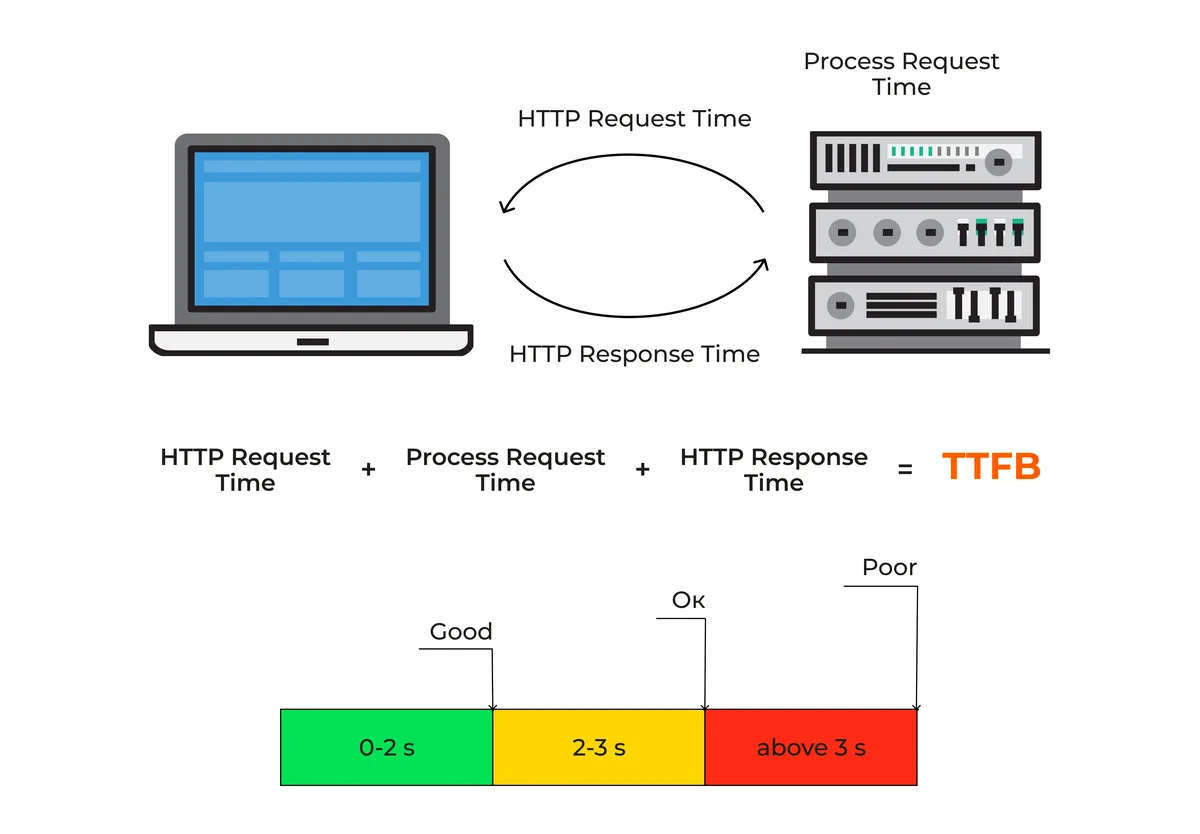
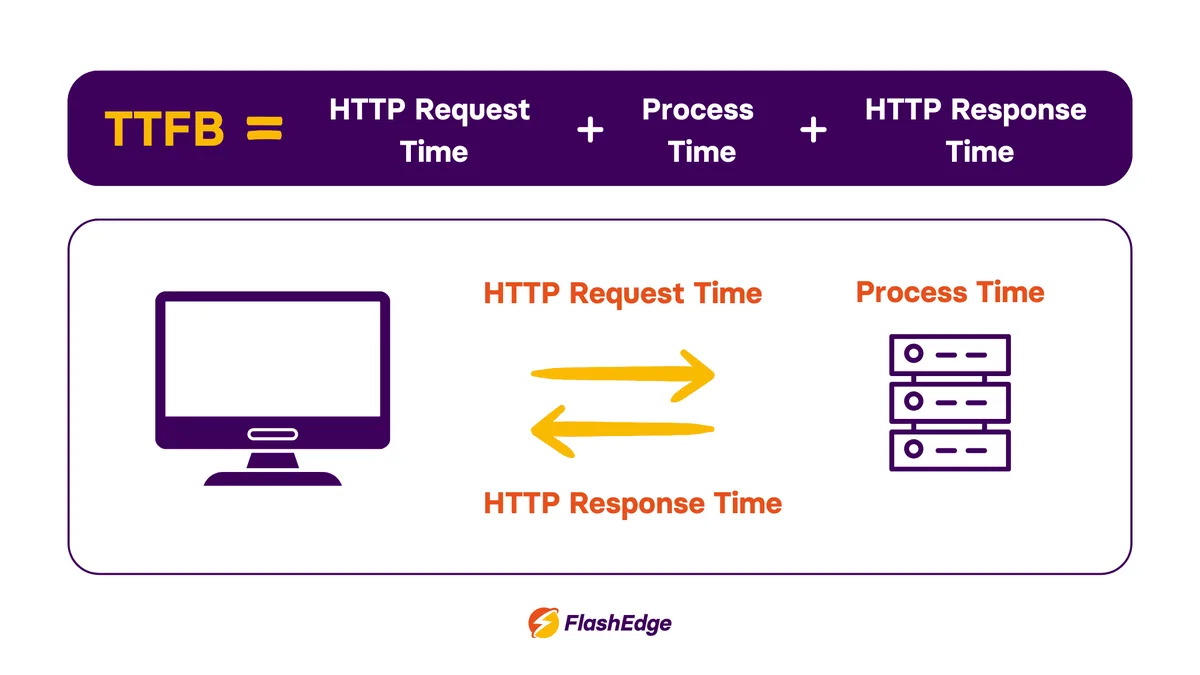
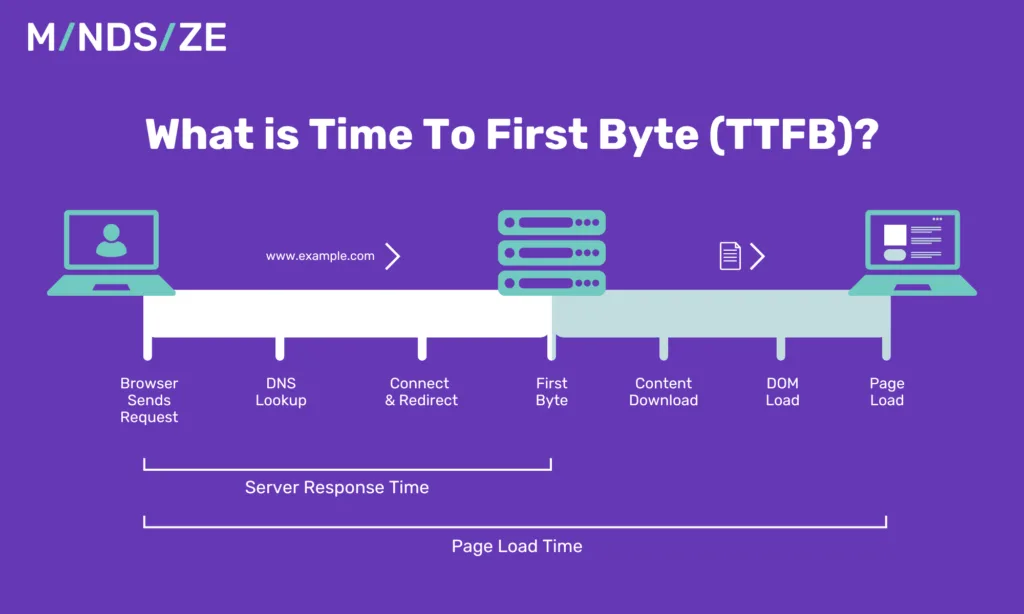
Time to first byte, in plain terms, is the duration between a browser firing off an HTTP request and the arrival of the very first byte of the server’s response.
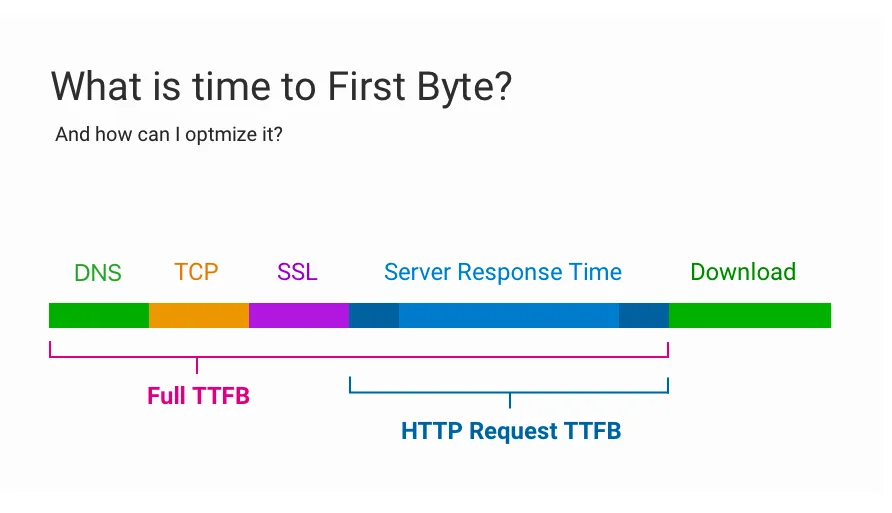
It bundles together DNS resolution, connection establishment, TLS negotiation, the request reaching the origin server, and then whatever processing the server does before it finally spits out a response header. Every one of those stages adds to the total.
Here’s where people get confused. Focusing on time to first byte provides clear direction here. TTFB, as it’s often abbreviated, is not a single number in a vacuum.
It’s a chain of events, and a slow link anywhere in that chain — a sluggish DNS resolver, a distant CDN edge node, a database query that scans a million rows — inflates the whole measurement.
That’s why a time to first byte tips session that starts with “just move to a better host” usually ends with a shrug, because the real culprit is often app-level latency, not infrastructure.
Picture your server as a barista in a crowded café. The clock starts when you place the order, not when the espresso machine whirs to life. If the barista has to walk to the back room to fetch a fresh bag of beans, you’re waiting. TTFB counts every one of those trips.
Why This Metric Matters for SEO and User Experience
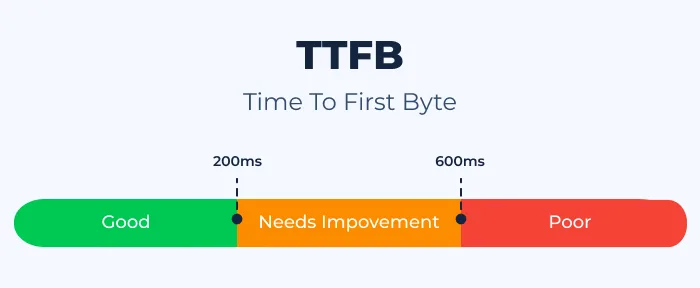
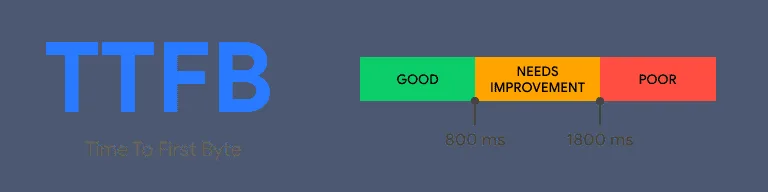
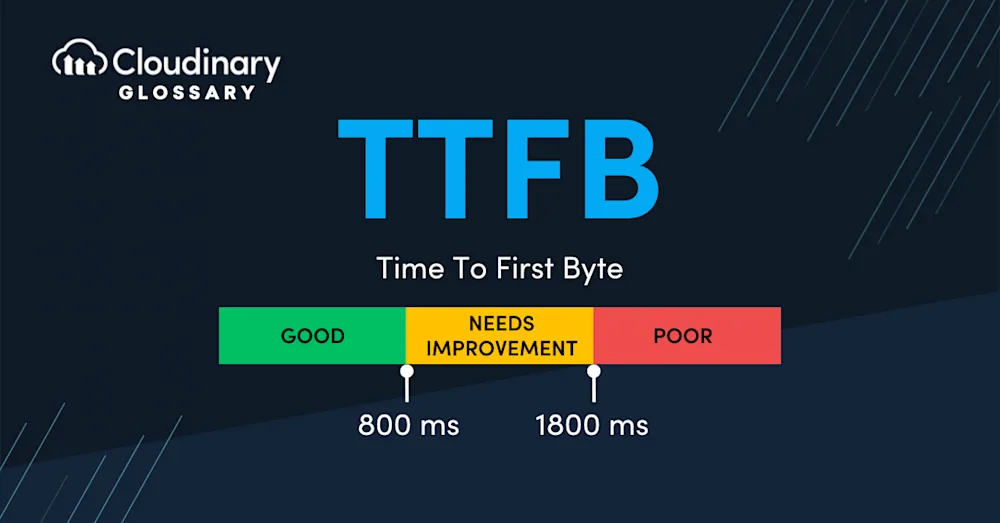
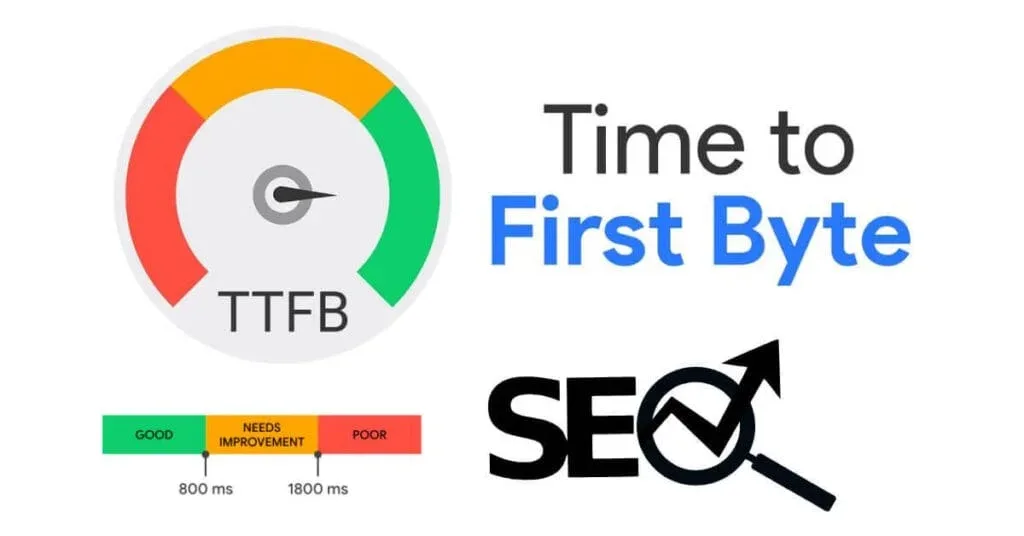
Google explicitly names time to first byte as part of its Core Web Vitals diagnostic toolkit — not a scoring Core Web Vital itself, but a recommended target all the same. The search giant’s guidance suggests keeping it under 0.8 seconds.
Cross that line consistently and you’re essentially telling Google your server takes its time serving pages, which is never a good signal.
But honestly, the SEO argument is the smaller half of the story. Real users feel TTFB viscerally. A half-second delay at the server level and the page feels sticky, unreachable, like the internet is on hold.
Studies over the years — from Amazon’s well-known latency research to experiments run by firms like Portent — have consistently shown the time to first byte speed affects conversion. Every hundred milliseconds matters.
“You can’t optimize what you don’t measure” is a tired line, but with TTFB specifically, teams routinely measure the wrong thing. They look at their own laptop on office Wi-Fi and call it a day. Let me put this in perspective. If you’re running an ecommerce site and TTFB hovers at 1.2 seconds, you’re looking at silent abandonment — people hitting back, opening a competitor’s tab, and never telling you why. The cause won’t show in your analytics as “TTFB was slow.” It’ll show as “bounce rate spikes on mobile.” That’s the trap.
Building a Time to First Byte Checklist: the Ten Best Practices
Here’s the heart of this time to first byte best practices guide. Each of the ten items below represents a distinct lever you can pull, roughly in order of impact versus effort for a typical web team. Some take an afternoon. Some are multi-week projects. All of them matter.
Before diving in, one piece of advice I’d give any team: don’t try to fix everything at once. Pick two or three that match your pain points, measure the impact, then move to the next batch. The compounding effect is where the payoff lives, not in any single intervention.
1. Instrument Your TTFB Measurement Before You Touch Anything
I know, “measure first” sounds like filler advice. It isn’t. Most teams that come to me complaining about slow time to first byte have no idea what their actual baseline looks like — they’ve just been told by a tool that the number is bad. They’ll screenshot a Lighthouse report and call that data. It’s not.
Real measurement means breaking TTFB into its component parts. Effective execution in your time to first byte makes a tangible difference. Chrome DevTools will show you the aggregate, but tools like WebPageTest let you see DNS lookup, initial connection, SSL negotiation, and waiting time as separate line items.
That breakdown is everything, because it tells you where to aim. If “waiting” dominates, it’s server-side processing. If “DNS lookup” dominates, your resolver is the problem.
Run the test from multiple geographies, too. Maintaining clarity across your time to first byte remains essential. A server in Frankfurt serving users in Singapore will show radically different numbers than what you see from Berlin office Wi-Fi. And please, please test on mobile networks — 4G latency tells a different story than your gigabit fiber connection.
2. Use Caching Layers to Short-Circuit the Request Path
Caching is the single most effective time to first byte tactic in existence. When a request can be answered from a cache rather than generated fresh, you can shave seconds off TTFB with fairly modest effort.
The layers stack: browser cache, CDN edge cache, full-page cache at the origin, then object cache (Redis, Memcached) behind the application itself.
For WordPress sites specifically, when refining a time to first byte, full-page caching plugins like WP Rocket or server-level solutions like Varnish handle a huge portion of the work. For Drupal and Laravel apps, the anonymous page cache is often underutilized.
I once worked with a media site where enabling proper edge caching took their TTFB from 1.8 seconds to 140ms on cached pages — with no code changes, just configuration.
The key insight here is the time to first byte TTFB on cache hits and cache misses are essentially two different metrics. Monitor both. A 200ms cache-hit TTFB with a 4-second cache-miss TTFB means you need to focus on cache ratio (how many requests get served from cache), not raw server speed.
3. Reduce Server-Side Processing Time
If your TTFB breakdown shows “waiting” as the dominant chunk of time, the time to first byte’re looking at the server. That server might be slow because it’s doing too much work per request, or because its runtime is inefficient. Both are fixable.
On the “too much work” side, profile your request handlers. Applying these principles to your time to first byte yields measurable results. Slow database queries are the classic culprit — an unindexed column, a missing JOIN, a query fetching 10,000 rows when it needs 10.
On the runtime side, compare PHP versions (each major version since 7.x has reduced request overhead), tune PHP-FPM pool sizes, and check your OpCache settings. If you’re on a modern application stack, use server-side rendering judiciously — a React app that server-renders everything on every request will murder your TTFB.
I’ve watched teams swap hosting providers to fix TTFB when a two-hour profiling session would have found the actual culprit: a single function doing a looped API call to an internal service. Proper attention to your time to first byte sets a strong baseline. The hosting swap cost them a month of migration work. The profiling session cost them an afternoon.
4. Deploy a CDN With Real Origin Awareness
Content delivery networks are standard fare at this point, but not all CDNs treat time to first byte equally. The magic is in edge-to-origin behavior: a good CDN will keep connections warm to your origin server, pool requests, and occasionally serve stale content during origin trouble. Cloudflare, Fastly, Akamai, and AWS CloudFront all offer this in various flavors.
The reason a CDN helps TTFB isn’t just geographic proximity — it’s that the connection between your user and your infrastructure is shortened dramatically. The TLS handshake, the DNS lookup, the TCP slow-start phase — all of it happens against the nearest edge node rather than a server that might be a continent away. That alone can cut hundreds of milliseconds off the round trip.
Get the caching rules right, too. Developing your time to first byte with precision highlights key strengths. Too many teams configure their CDN with a “cache everything except nothing” default, then wonder why TTFB is still slow.
Set dynamic content to a short TTL, use stale-while-revalidate headers, and let the edge do the work it was designed to do.
5. Tune the Network Layer: DNS, TLS, and Protocol
This is where the boring plumbing makes the biggest difference. Time to first byte includes three network handshakes before the server even sends a byte: DNS resolution, TCP connection establishment, and TLS negotiation. Each of these is an opportunity to save an RTT (round-trip time) if you configure things properly.
Start with DNS. Use a performant resolvable DNS provider, enable DNS prefetching for third-party domains your pages need, and audit the number of distinct hostnames you connect to — each one requires a fresh DNS lookup the first time a visitor hits the page. Reduce the count where you can, and consolidate providers where you can’t.
For TLS, enable TLS 1.3 (which reduces the handshake round trips), use OCSP stapling to avoid a separate validation call, and keep session resumption enabled. Clear alignment with your time to first byte builds confidence from the start.
Then there’s HTTP/2 or HTTP/3 — both reduce the latency penalty of many simultaneous requests, which matters for TTFB measurement accuracy as much as for the user experience.
If you’re not already on HTTP/3 (QUIC), the migration is worth considering. It eliminates TCP’s head-of-line blocking and often shows noticeable TTFB wins on mobile networks specifically, where packet loss is common.
6. Optimize Database Queries and Architecture
Here’s a number the time to first byte might sting: most slow-database-driven TTFB problems come from fewer than ten query patterns that repeat across the codebase. You don’t need a wholesale architecture rewrite. You need to find those ten patterns and fix them.
Start with slow query logs. Identify the top offenders by frequency and by latency. Enable query caching where appropriate. Check your indexes — I’ve seen production sites where an obvious index was simply missing because “the developer left.” Look for N+1 query problems, especially in modern ORM-heavy frameworks where they multiply quickly on listing pages.
The time to first byte’s also a subtler issue: connection pooling. If your application opens a new database connection per request instead of using a pool, you’re adding 10-50ms every single time. PgBouncer for Postgres, ProxySQL for MySQL — pick the tooling and configure it. Your TTFB will thank you.
7. Consider Static Site Generation and Edge Side Rendering
The most underrated time to first byte best practice involves choosing an architectural pattern where TTFB becomes almost irrelevant: generating pages ahead of time. Static site generation with a framework like Next.js, Astro, or Hugo turns most requests into file lookups, moving TTFB into the 20-100ms range when hosted on a proper edge network.
Not every site fits that pattern, of course. Dashboards, personalized feeds, and authenticated views all require server logic per request. But a surprising percentage of content — marketing pages, blog posts, product listings, category pages — can absolutely be generated statically and hydrated client-side for interactivity.
A hybrid approach often wins: static generation for public traffic, edge-side rendering (via platforms like Netlify, Vercel, or Cloudflare Workers) for pages the time to first byte need light personalization, and origin rendering only for logged-in users. This tiered approach is what separates sites with <150ms TTFB from sites that scrape by at 900ms.
8. Reduce Third-Party Requests in the Critical Path
Third-party scripts are a sneaky time to first byte killer. Tag managers, analytics, chat widgets, A/B testing tools, ad networks — each one adds requests that compete for connection slots and CPU time, indirectly pushing back the moment your actual content starts to arrive.
While these don’t literally inflate the byte-first signal, they inflate the perceived TTFB for a real user on a real device.
Audit your third parties ruthlessly. Refining each detail of your time to first byte strengthens this section. For each one, ask: does it need to load on every page, every session, or can it be deferred? Can it be loaded after the first meaningful paint rather than blocking?
Will the vendor let you host the script on your own domain (self-hosted tag containers) to remove the extra DNS hop?
Google Tag Manager can be configured to delay non-essential tags, and many chat widgets can be lazily loaded. Every removed third party is a small TTFB win and a bigger budget win for user experience.
9. Load Test and Monitor Continuously
One-shot TTFB measurements are essentially useless. Your number fluctuates wildly based on traffic patterns, cache warmth, database state, and even noise on the network. A time to first byte checklist that doesn’t include continuous monitoring is only half a checklist.
Set up real-user monitoring (RUM) using tools like SpeedCurve, Datadog RUM, or New Relic Browser. These capture TTFB from actual visitors, segmented by geography, browser, connection type, and page type. Compare against synthetic monitoring from services like Pingdom or WebPageTest to catch regressions during off-hours.
Load testing matters, too. A site that performs well with ten users may crumble with a thousand. Use tools like k6 or Locust to simulate realistic traffic patterns. If your TTFB stays under 300ms at 5x expected peak volume, you can sleep reasonably well at night. If it craps out at 2x, you’ve got work to do before the next marketing campaign.
10. Tune Application-Level Configs and Runtime Parameters
The last of these time to first byte tips is the least glamorous but often the most immediate payoff: runtime and application configuration.
PHP-FPM pool sizing, OpCache preload, JVM garbage collection tuning, Node.js event loop monitoring, Python worker settings — every runtime has knobs that affect per-request latency in ways that don’t show up in feature tickets.
Concretely: enable OpCache with reasonable memory settings for PHP apps and consider preloading the time to first byte on startup. Set PHP-FPM pm.max_children to match your available RAM divided by average process memory. For Node.js, watch for synchronous code blocking the event loop. For JVM apps, tune the GC algorithm and heap size to your workload shape.
Also review your HTTP server configuration — nginx or Apache worker counts, compression settings (gzip or Brotli), keep-alive timeouts, and connection limits. Small misconfigurations here produce wildly variable TTFB depending on contention. Brotli compression in particular, applied to HTML at the edge, is one of those quiet TTFB wins that surprises people.
Common Mistakes That Quietly Undermine Time to First Byte
For all the best practices, the time to first byte’s a graveyard of recurring mistakes. Here are the ones I see most often, because knowing the traps helps avoid wasted effort.
First, measuring TTFB while logged in as an admin with a debug toolbar active. Every query, every loaded extension, every cache bypass — all of it inflates the reading. Test anonymously or in incognito mode with cache behaving normally.
Second, confusing TTFB with “fully loaded time.” A page that returns first byte in 100ms but takes three seconds to render isn’t good TTFB plus bad render — it’s a different metric entirely and requires different remediation.
Third, running tests from the wrong network. Your office connection is not your user’s connection. Test from real client networks, using throttled profiles. Fourth, ignoring mobile performance because desktop looks fine. TTFB on 4G is often two to three times what it is on fiber.
How the Rest of Your Performance Budget Fits In
TTFB is one piece of a larger puzzle. The rest of your Core Web Vitals — Largest Contentful Paint, Interaction to Next Paint, Cumulative Layout Shift — depend on the speed at which the browser can begin rendering content.
If TTFB is awful, the time to first byte metrics suffer even with perfect subsequent optimization. Think of TTFB as the flick of the starter’s pistol; the race can’t finish fast if the start is slow.
This is why a holistic approach matters. Make sure your images are properly sized and served in modern formats (AVIF, WebP). Keep JavaScript bundles lean. Render critical CSS inline. All of it works together, and a good time to first byte number is the foundation the rest is built on.
If you’re looking for a broader reference, real-world web performance teams publish case studies through the Web Performance Calendar, and the web.dev documentation is genuinely excellent for the technical details. Cross-referencing multiple sources is what makes a time to first byte guide worth its weight.
TTFB Range
Assessment
Typical Action
Under 200ms
Excellent
Monitor; maintain
200-500ms
Good
Look for easy wins
500-800ms
Borderline (Google threshold)
Prioritize fixes
800ms-1.5s
Poor
Deep audit needed
Over 1.5s
Critical
Immediate remediation
Frequently Asked Questions About Time to First Byte
Here is an in-depth breakdown of key considerations regarding Frequently Asked Questions About Time to First Byte:
Is Time to First Byte a Core Web Vital?
No, but it’s tightly related. Google treats TTFB as a diagnostic metric rather than a scored Core Web Vital. It doesn’t appear in the Core Web Vitals report directly, but poor TTFB almost always drags down Largest Contentful Paint, which is scored. Treat them as companions, not substitutes.
What’s a “good” TTFB Number in Practice?
Google recommends under 0.8 seconds; most performance engineers aim for under 500ms, and the best sites routinely hit under 200ms for cacheable content. Anything above 800ms is worth serious investigation. That said, a highly dynamic, personalized application can reasonably tolerate higher numbers on its most complex views — a static marketing page cannot.
Why Does My TTFB Vary So Much Between Tests?
Because TTFB is a chain of network and server events, each with its own variance. Cache state changes between requests, DNS resolvers cache or don’t cache, TLS session reuse kicks in or doesn’t, and server load fluctuates throughout the day. Run twenty tests across different times and geographies before drawing conclusions from any single reading.
Does Moving to a Faster Host Always Fix TTFB?
Almost never as a first move, no. Infrastructure improvements help, but most slow TTFB issues live in application code, database query patterns, or cache configuration. If you fix hosting first and ignore the code, you’ll pay more for the same latency — just on faster hardware. Profile, then decide.
How Does TTFB Affect Conversions?
The causation is indirect but real. Slow TTFB creates a delay before anything renders, which increases perceived wait, which correlates with bounce and abandonment. Teams that fix TTFB from, say, 1.2s to 300ms often see measurable improvements in conversion rate and engagement metrics — but the effect is subtle and requires clean attribution to prove.
Can I Improve TTFB for Logged-in Users Too?
Yes, though it’s harder. Anonymous traffic caches easily; authenticated traffic generally bypasses full-page caching. Techniques like edge-side includes (ESI) for personalized fragments, cached partials, and backgrounded non-critical queries help. The trade-off is complexity — you’re essentially moving the personalization logic closer to the edge and away from origin.
Wrapping This Up: a Working Formula
If you take away nothing else from this time to first byte guide, let it be this: TTFB is a chain, not a number. Improve the weakest link, then move to the next. Instrument first, cache aggressively, tune the server, shorten the network distance with a proper CDN, and monitor continuously. The teams I’ve seen succeed at this don’t chase perfection — they chase consistency, and the numbers follow.
Treat this as your starting framework, not a finished list. Every stack has its own quirks, and your most valuable time to first byte tips will come from your own analytics, your own user data, and your own hands-on testing. Start with measurement, ship wins iteratively, and revisit the checklist whenever your TTFB creeps up.
If you want to go deeper, look at related areas like Core Web Vitals optimization, caching strategy, and edge compute patterns — those three topics together give you the strongest foundation for any speed work ahead.