Largest Contentful Paint: What Every Beginner Needs to Know
Largest contentful paint is the moment a browser finishes rendering the biggest visible element in the viewport. Think of it as the “main picture has arrived” signal for your page.
If you’ve ever stared at a blank screen while a website slowly assembled itself, you already understand why this metric matters. That wait is what Core Web Vitals measure, and the largest contentful paint guide below walks you through it from square one.
No jargon walls. Focusing on largest contentful paint provides clear direction here. No assumptions. Just a clear path from “what is this thing” to “how do I fix mine.”
Why Largest Contentful Paint Became a Core Web Vital
Google didn’t invent the largest contentful paint metric on a whim. Before it existed, tools like First Contentful Paint told you when the very first pixel appeared, but that was a weak proxy for real user experience. A page could show a tiny spinner for three seconds and still “pass” FCP while users sat there fuming.
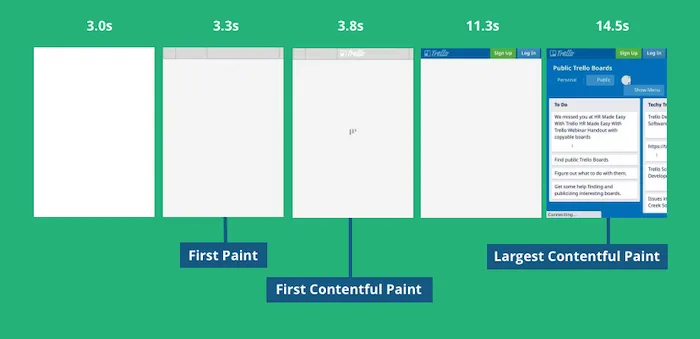
The largest contentful paint metric was introduced to capture something closer to what a person actually feels: the moment the screen stops looking empty and starts looking useful.
The Shift from Technical Signals to User Perception
Older performance metrics were about the network. This one is about perception. That shift changes how you should think about optimization.
You’re no longer asking “did the server respond fast enough?” You’re asking “did the user see the thing they came for?” A slow server can still produce a decent LCP if the critical image is small and prioritized. Conversely, a lightning-fast server can fail if a giant hero image blocks the main slot.
That distinction trips up a lot of beginners. They fix the backend, throw in a CDN, and wonder why the score barely moves.
How It Fits With INP and CLS
Core Web Vitals has three pillars. Largest contentful paint covers loading. Interaction to Next Paint covers responsiveness. Cumulative Layout Shift covers visual stability.
They’re scored together, but they fail independently. A page can load its hero image quickly, then punish the user with jumpy buttons and laggy clicks.
Beginners often chase one metric and ignore the others. That’s why so many sites sit in the “needs improvement” band no matter how many images they compress.
How Browsers Determine the Largest Contentful Paint Element
Here’s where it gets concrete. The browser watches the viewport as it renders. Every time a new candidate appears—an image, a video poster, a block of text, a background graphic—it checks whether that element is bigger than the previous champion.
When the page finishes loading and the user starts interacting, the browser stops updating the candidate list and locks in the final timestamp. That final timestamp is your largest contentful paint value.
You can watch the candidates change in DevTools under the Performance panel. It’s genuinely illuminating to see a paragraph of text briefly win the crown before a late-loading image snatches it back—and pushes the metric later by a full second or more.
Which Elements Count as Candidates
| Element Type | Counted? | Notes |
|---|---|---|
| <img> elements | Yes | Standard image tags, including srcset variants |
| <image> inside SVG | Yes | Only the <image> node, not the whole SVG |
| <video> poster image | Yes | The poster frame, not the playing video |
| Background image via CSS | Yes | URL() on an element, not gradients |
| Block-level text | Yes | Paragraphs, headings, list blocks |
| Canvas-embedded content | No | Excluded from the candidate set |
That table alone answers half the questions beginners post in forums. If your candidate isn’t in the “yes” column, optimizing it won’t move your score.
The Timing Cutoff: When the Metric Stops Updating
One subtlety most tutorials skip: the largest contentful paint clock doesn’t run forever. It freezes when the user first clicks, taps, or scrolls, and it also stops when the page fires its load event.
Why does that matter? Because lazy-loaded content far below the fold won’t rescue a bad score, and because an early scroll by an impatient user can lock in a mediocre value.
In practice, this means you should think of the metric as “how fast did the first meaningful viewport fill in,” not “how fast did everything finish.”
What Counts as a Good Largest Contentful Paint Score?
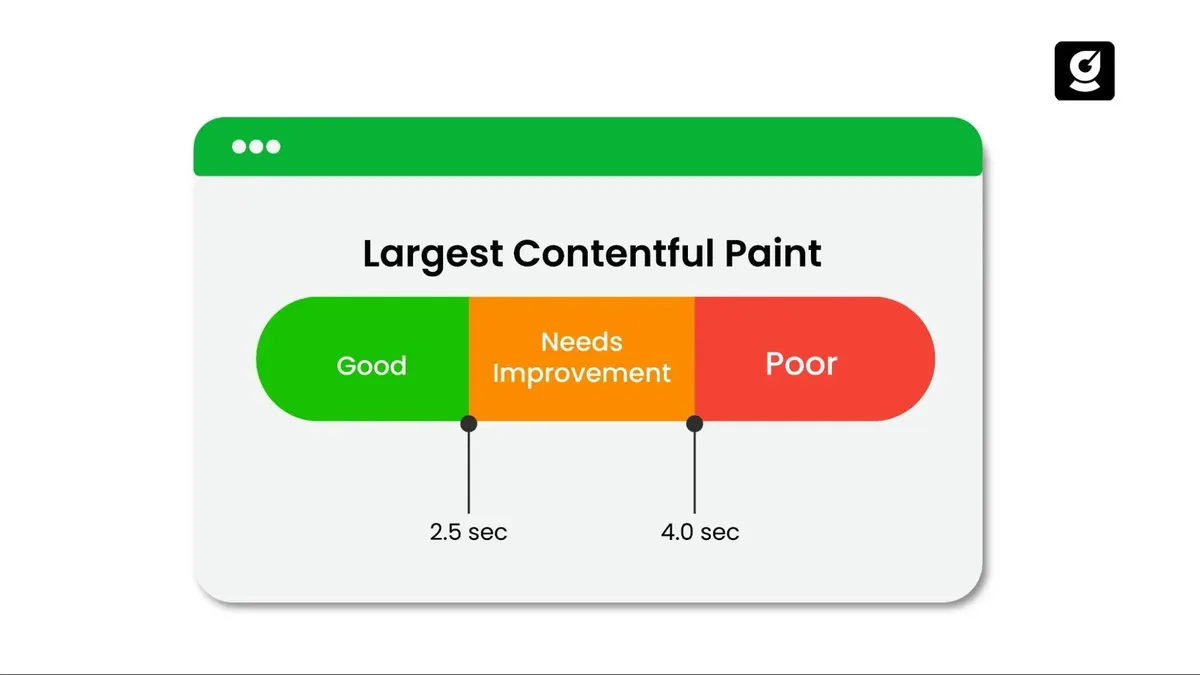
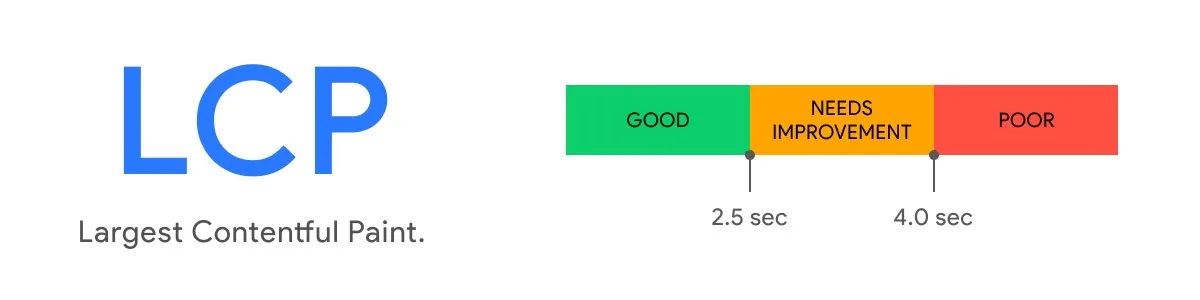
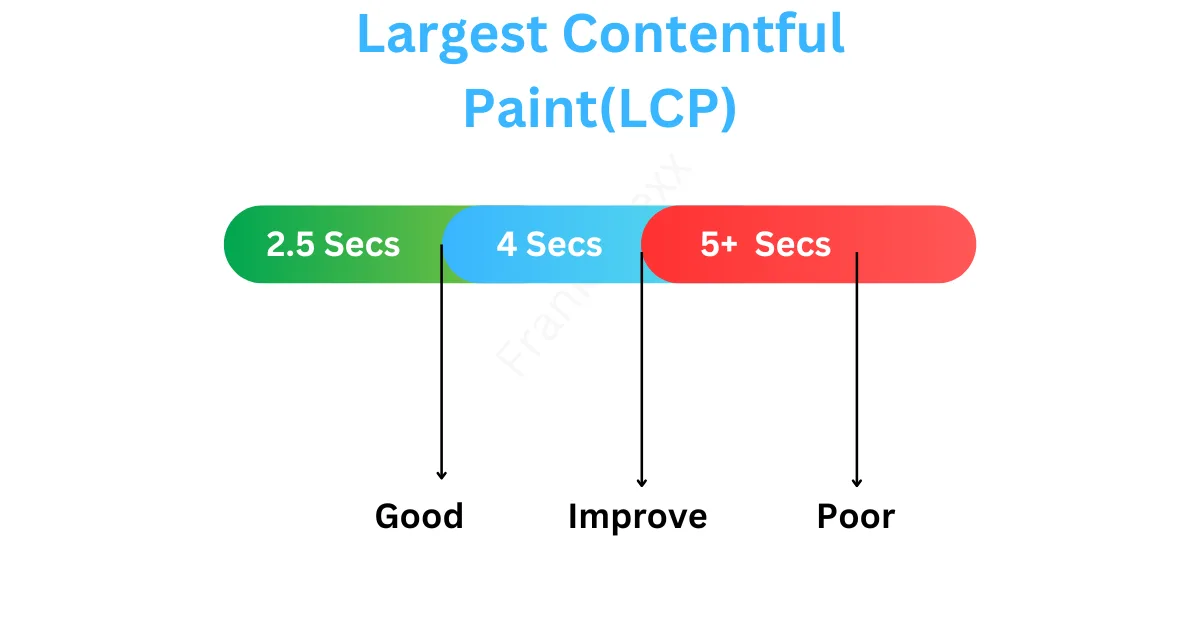
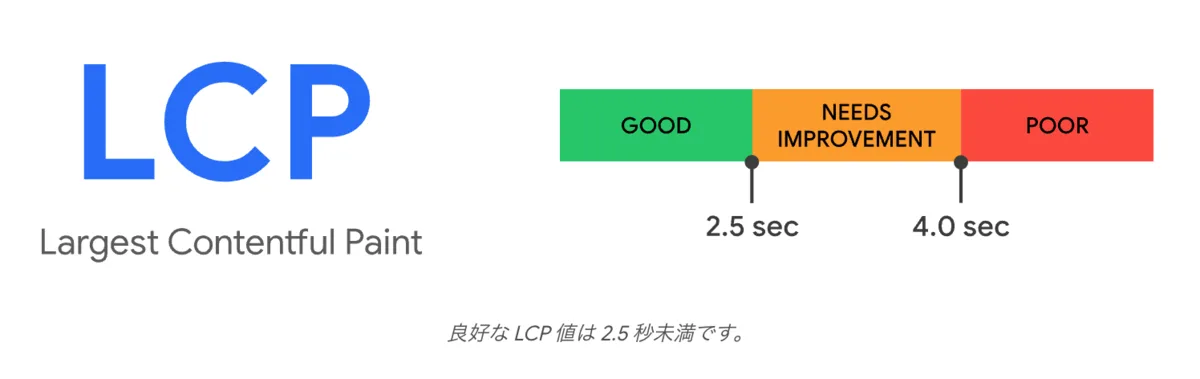
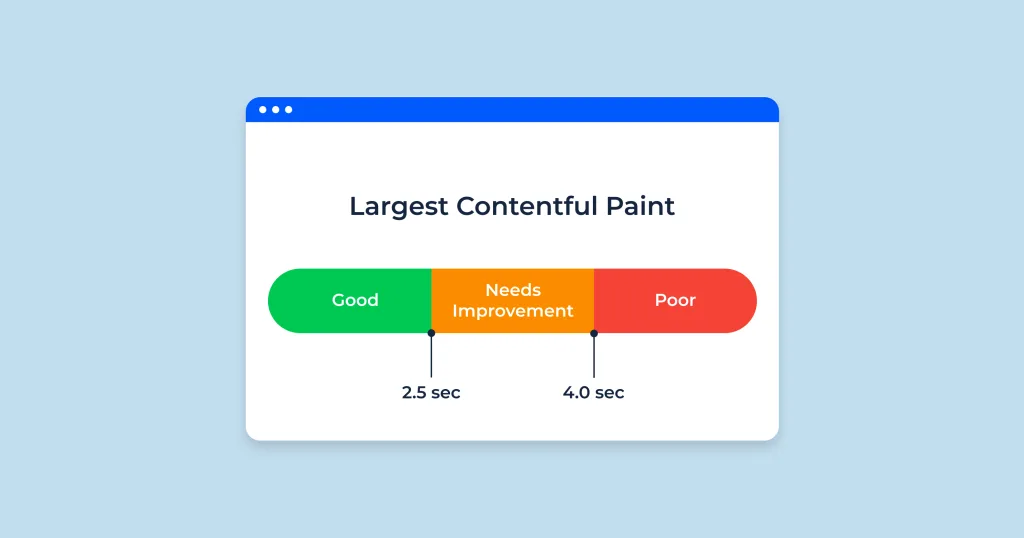
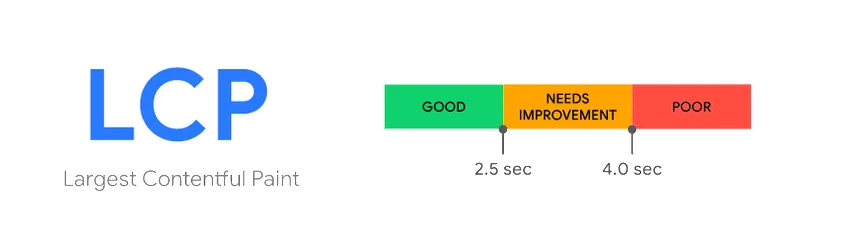
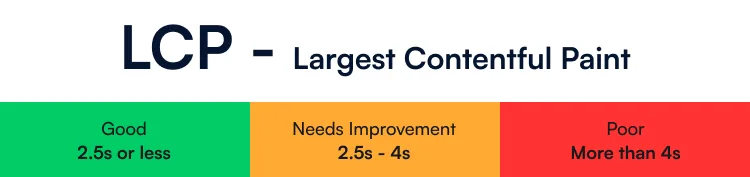
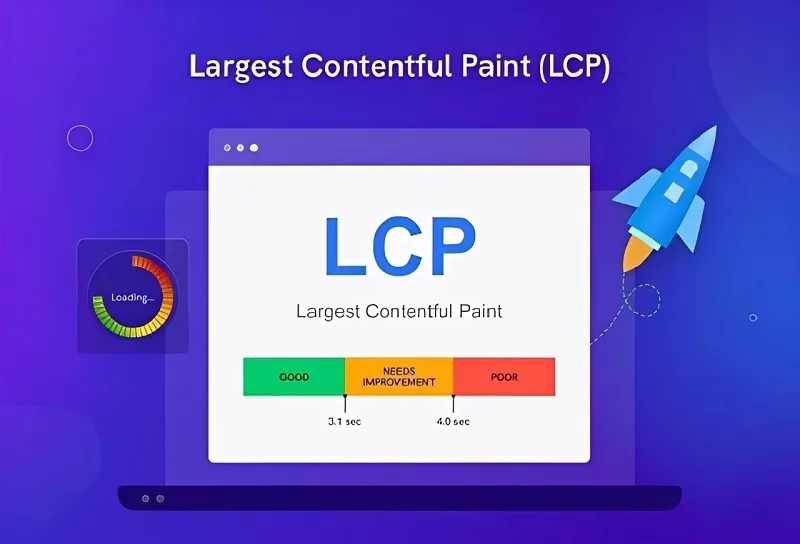
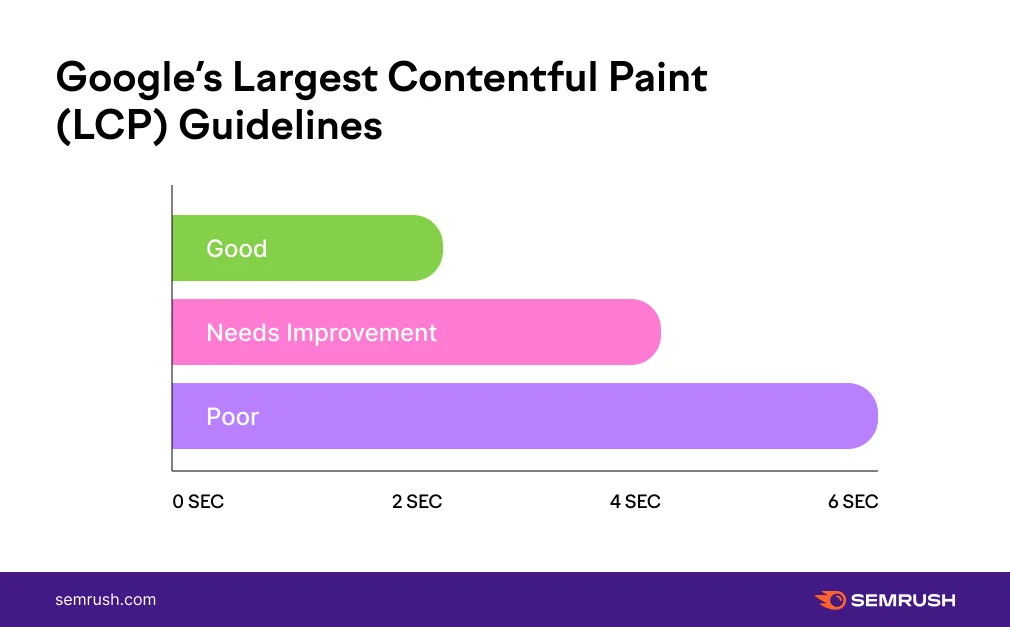
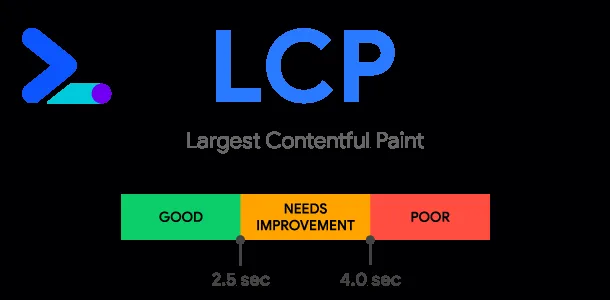
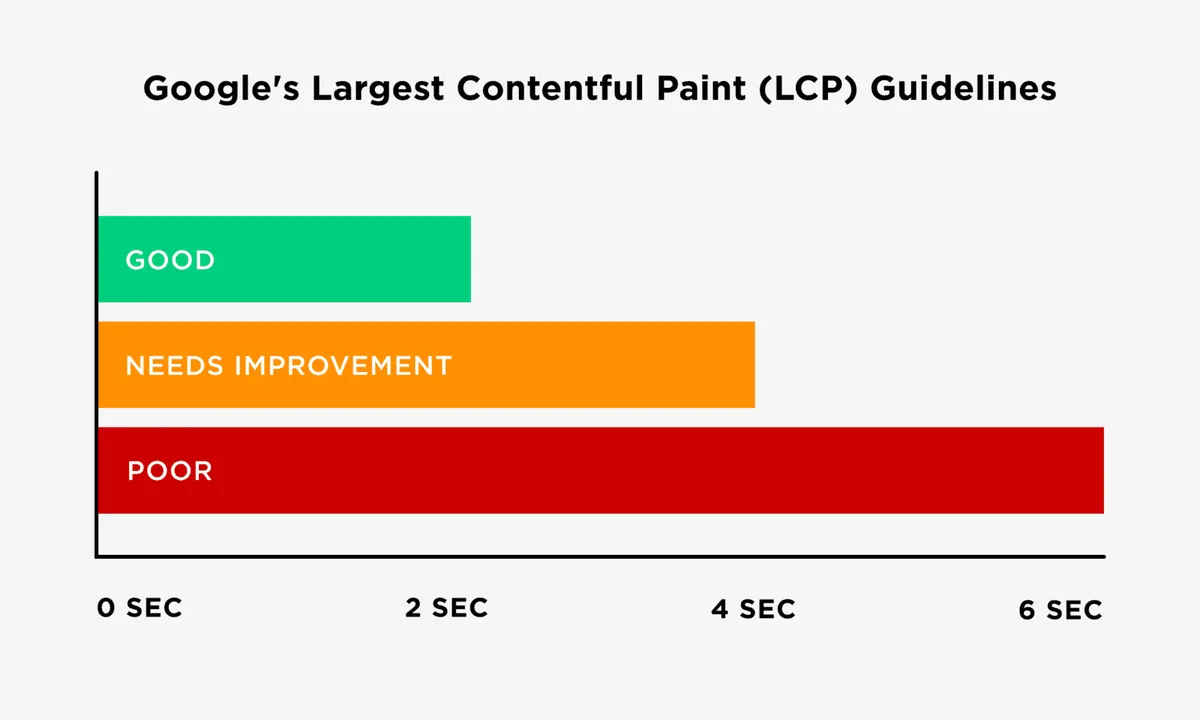
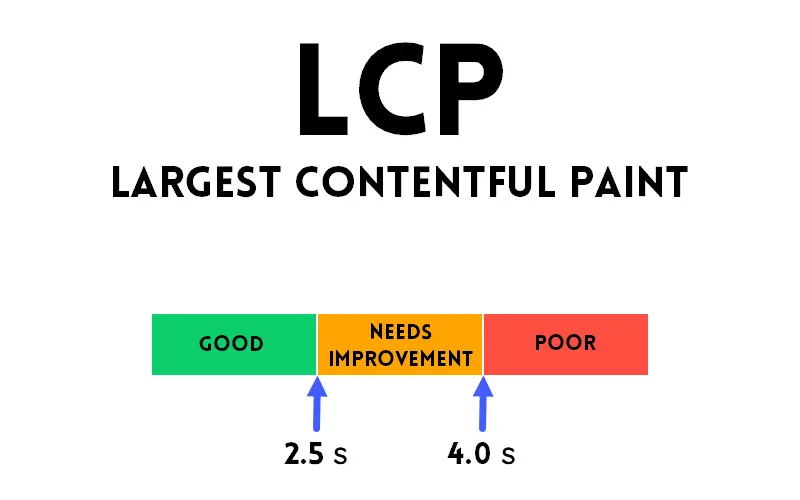
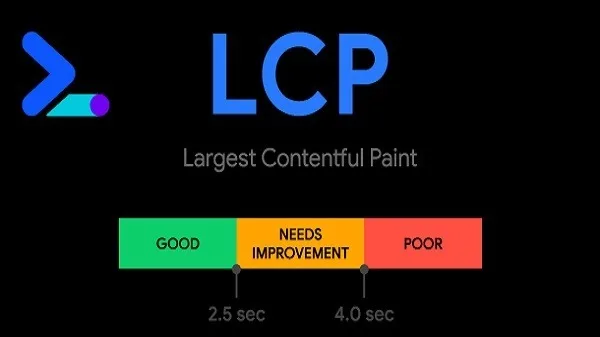
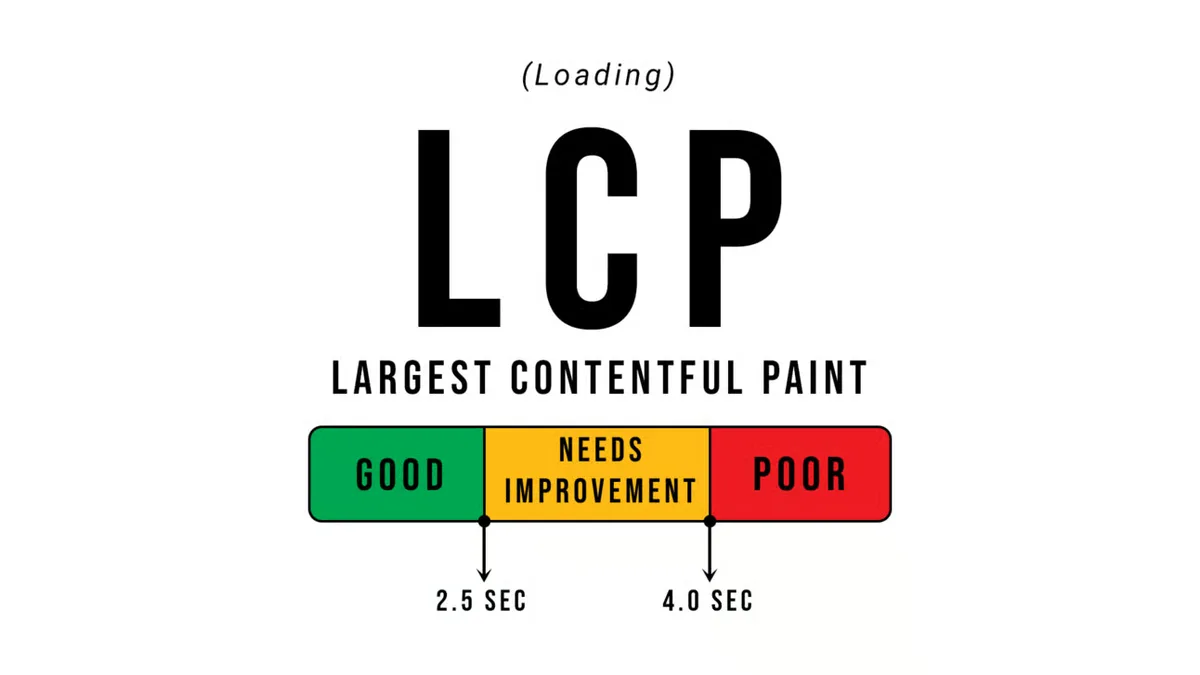
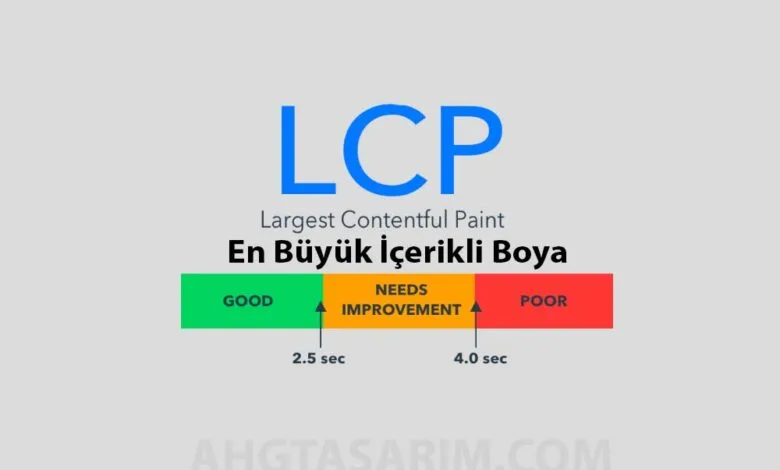
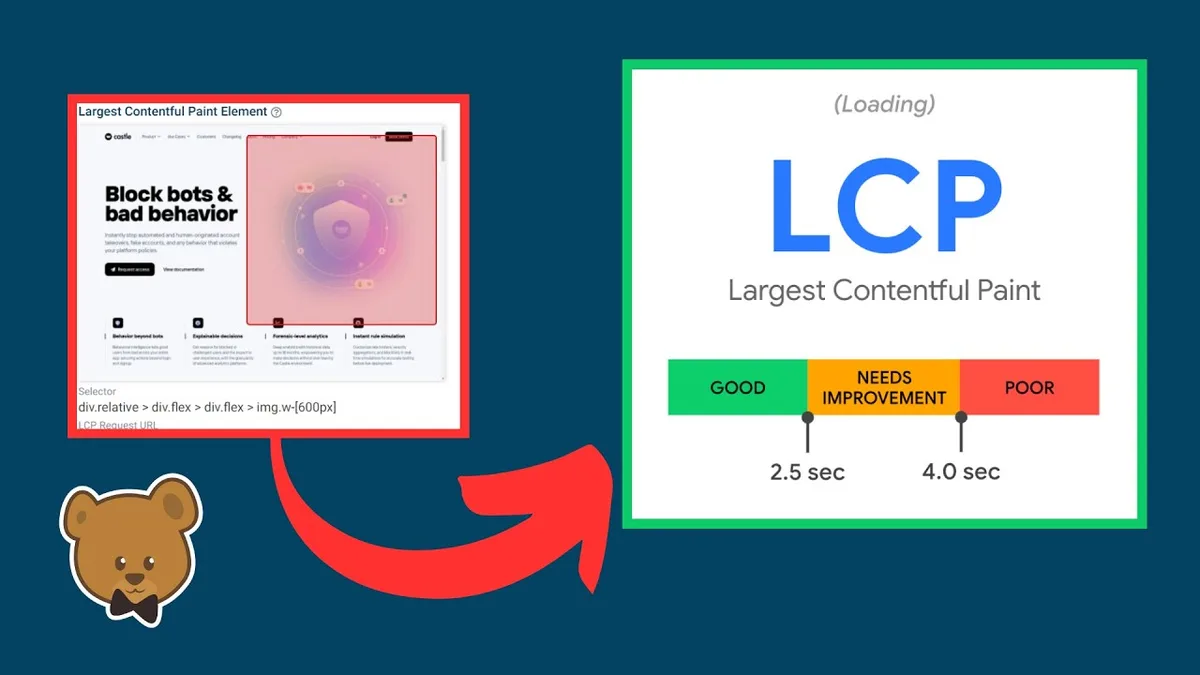
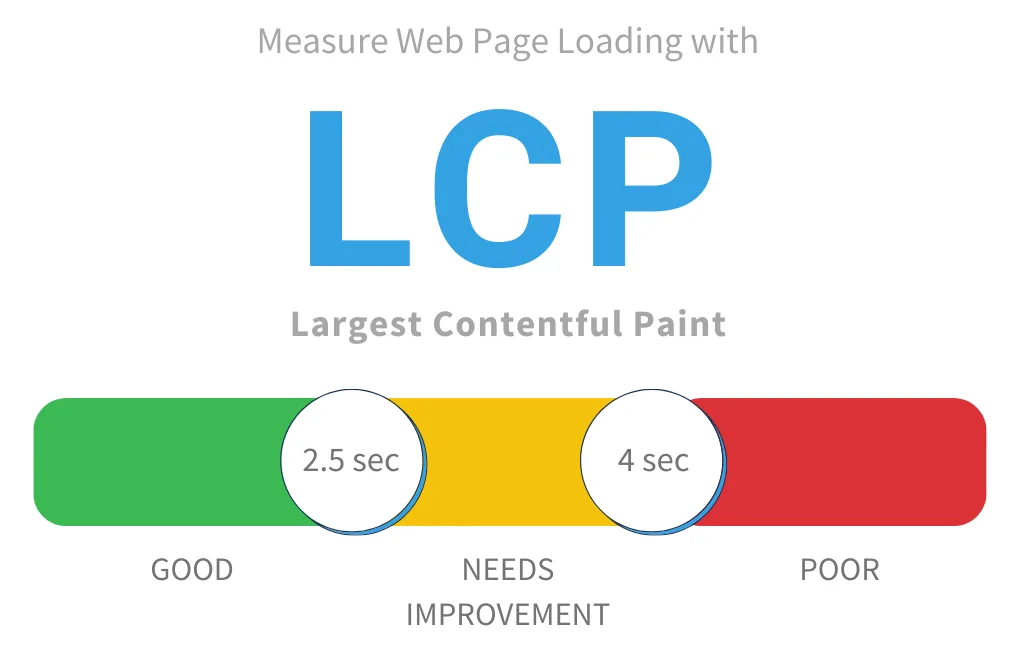
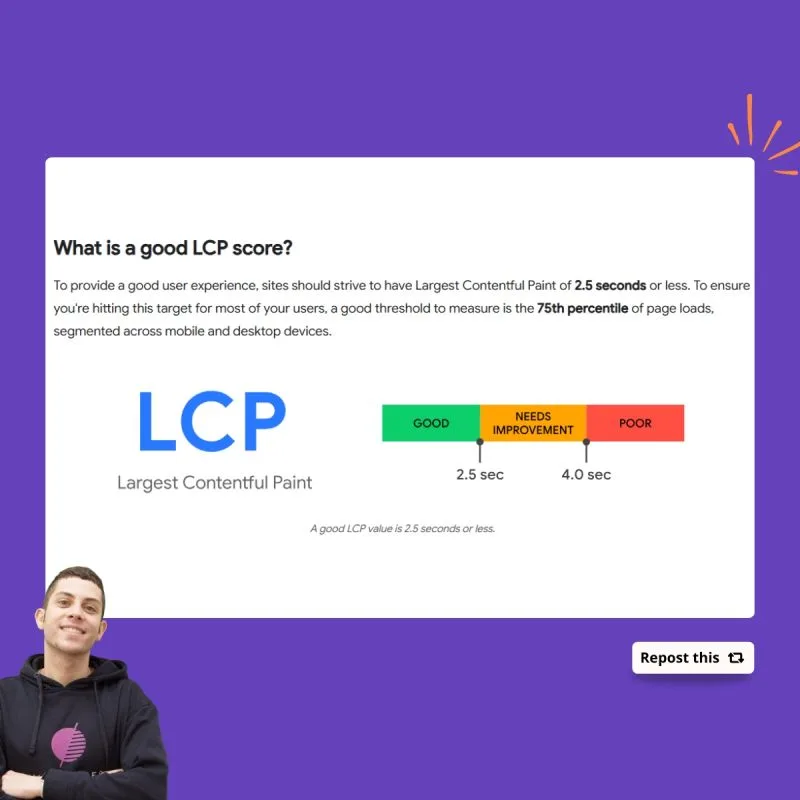
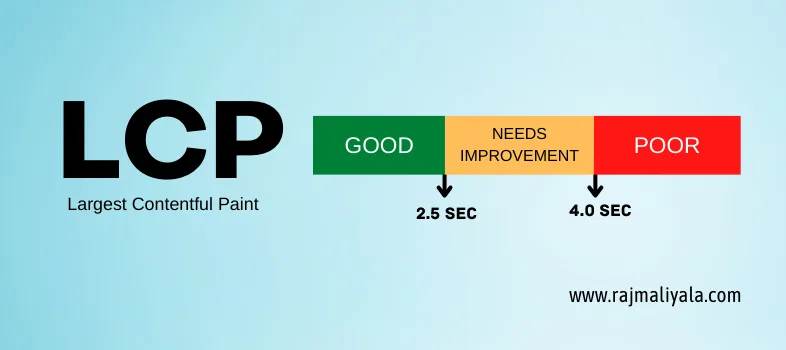
The thresholds are simple and non-negotiable. Under 2.5 seconds is good. Between 2.5 and 4 seconds needs work. Past 4 seconds is poor.
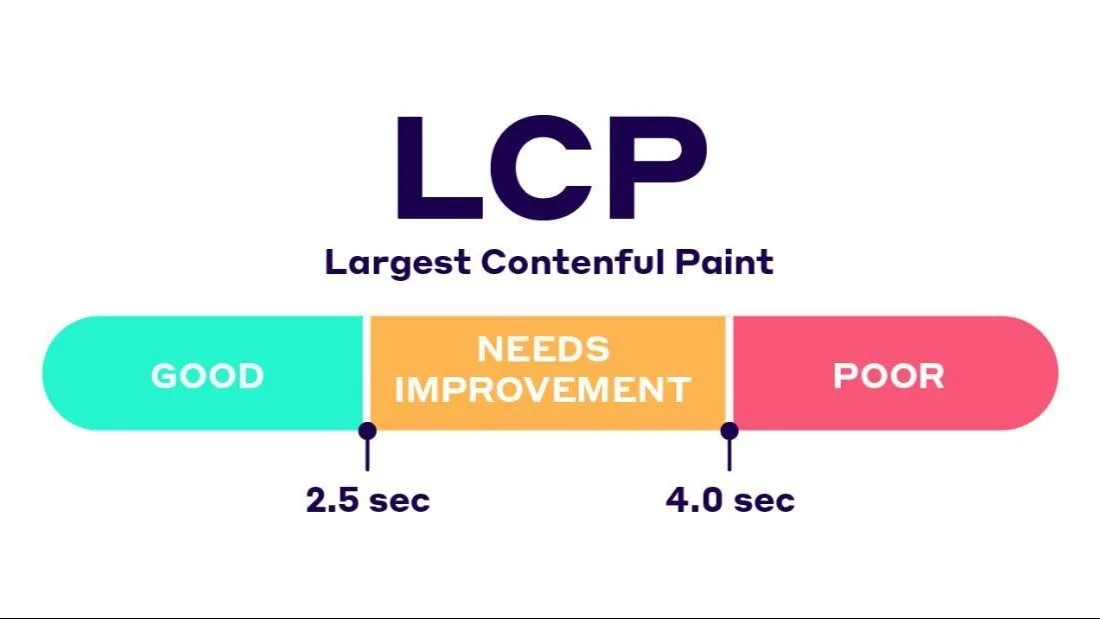
The largest contentful paint numbers come from real-user data collected at the 75th percentile—meaning three out of four visits need to hit that bar. Your own laptop on fiber is not the benchmark.
A largest contentful paint checklist worth its salt always starts with “measure with real users, not just synthetic tests.” Lighthouse is a snapshot; Chrome UX Report data is the verdict.
Field Data versus Lab Data
Field data comes from actual visitors on actual devices. Refining each detail of your largest contentful paint strengthens this section. Lab data comes from a simulated environment on your machine.
They disagree constantly, and beginners panic when they do. A site can score 1.4 seconds in Lighthouse and 3.8 seconds in the field. The gap usually comes from slower CPUs, weaker connections, or a location your lab machine doesn’t simulate.
Trust the field number for decisions. Use the lab number for debugging.
Reading the Distribution Curve
Don’t look at averages. Look at the spread.
A site with a 2.1-second average can still have 30% of users in the “poor” bucket. That’s the group that bounces. The 75th percentile target exists precisely because averages hide the tail.
When you open a CrUX dashboard, scan the histogram from the right side first. Fix the slow tail, not the fast middle.
Step 1: Diagnose Your Current Largest Contentful Paint
You can’t fix what you haven’t identified. Before touching any code, find out which element is actually holding the crown.
Open Chrome DevTools, go to the Performance panel, and record a page load with throttling enabled. Look for the LCP marker in the timeline. Hover over it—DevTools names the exact node that became the final candidate.
Nine times out of ten it’s a hero image. The tenth time it’s a web font rendering a giant headline, or a server-rendered text block waiting on a slow API.
Reading the Waterfall and Finding the Culprit
Once you know the element, trace its request chain in the Network tab. Ask three questions: When did the request start? How long did the server take? When did the browser render it?
If the request starts late, something upstream is blocking discovery—maybe the image is injected by JavaScript. If the server takes 800ms to respond, no amount of image compression helps.
If the file downloads fast but renders late, the browser is waiting on fonts, CSS, or a render-blocking script.
Step 2: Optimize the Element That Wins the Crown
Now the hands-on work begins. The single highest-leverage move is almost always compressing and correctly sizing that hero asset.
A common beginner mistake: uploading a 4000-pixel-wide screenshot for a 1200-pixel container. The browser downloads all four thousand pixels, then throws most of them away.
Serve responsive images with srcset and sizes. Effective execution in your largest contentful paint makes a tangible difference. Use WebP or AVIF. Aim for 100–200 KB for hero images, not two megabytes.
Preload the Hero Image
If the hero image is discovered late—because it’s set in CSS or rendered by a framework—the browser wastes precious milliseconds.
Add a preload hint in the head:
<link rel="preload" as="image" href="/hero.webp" fetchpriority="high">Combine that with fetchpriority="high" on the image tag itself and you’ve claimed your spot at the front of the queue. These largest contentful paint tips are the ones that produce instant, visible gains.
Text Can be the Candidate Too
Don’t assume images are always the problem. A big headline rendered in a web font that arrives 1.2 seconds late will drag the metric down just as hard.
Fix it with font-display: swap, preloading the font file, or falling back to a system font stack. If the text is server-rendered and fast, you’re in good shape.
Beginners often blame the network when the actual blocker is a 300KB webfont fetched from a third-party CDN.
Step 3: Cut the Network Chains That Delay the Crown
Even a perfectly compressed hero image can’t win if it sits behind six redirects and a string of render-blocking scripts.
Check for redirect chains. A single hop from HTTP to HTTPS to www can add 200ms or more before the first byte arrives.
Flatten them. Serve the final URL directly, and make sure your internal links point to canonical versions.
Eliminate Render-Blocking Resources
Scripts in the head without defer or async halt everything downstream. CSS files that aren’t critical can be loaded asynchronously.
This is one of the most underrated largest contentful paint best practices. A 50KB non-critical stylesheet in the head can cost you half a second before the browser even thinks about your hero image.
Move analytics, chat widgets, and marketing tags to deferred loading. They don’t belong in the critical path.
Step 4: Reduce Server Latency and TTFB
Your time to first byte is a floor. If the server takes 600ms to respond, the browser cannot render the largest contentful paint element faster than 600ms, period.
Use a CDN with edge caching. Cache HTML responses where possible. Move database queries off the critical path.
For dynamic pages, look at edge-side rendering or stale-while-revalidate strategies. The goal is to push TTFB under 200ms for the majority of users.
When Hosting is the Real Bottleneck
Sometimes the answer is boring: your shared hosting plan can’t keep up. This happens more than people admit.
If the largest contentful paint’ve optimized images, removed blockers, and preloaded everything correctly yet the metric stays above four seconds, look at server response times across regions. A host with a single data center will fail users on other continents.
Step 5: Manage Third-Party Scripts
Third-party scripts are sneaky. They load asynchronously, so they seem harmless in the waterfall, yet they consume CPU during the critical rendering window.
A tag manager with fourteen tags inside it can push the largest contentful paint element render later by a full second on a mid-range phone.
Audit every script. Delete what you don’t use. For the ones you keep, load them after interaction or on a delay.
Self-Hosting and Facade Technique
Self-host Google Fonts to avoid a second connection. Swap embedded YouTube videos for a lightweight thumbnail facade that loads the real player on click.
These moves are quiet, boring, and effective. They’re the difference between a 1.9-second score and a 3.4-second score on the same page.
A Practical Largest Contentful Paint Checklist
Here’s a printable sequence you can run against any page. Work top to bottom—each step depends on the one before it.
- Identify the element. Use DevTools or PageSpeed Insights to confirm which node is the final LCP candidate. Don’t guess.
- Measure field data. Pull CrUX data for the URL and check the 75th percentile, not the average.
- Compress and resize the hero asset. Serve WebP or AVIF at the correct display size.
- Preload the critical image or font. Add a preload hint with high fetch priority.
- Remove render-blocking CSS and JS. Defer everything non-critical.
- Check TTFB. If it exceeds 400ms, investigate hosting, caching, or database queries.
- Flatten redirects. One hop maximum between the typed URL and the final response.
- Audit third parties. Delay, defer, or delete every script that isn’t earning its keep.
- Re-test in the field. Give changes a week or two to show up in real-user data before judging.
This largest contentful paint checklist has saved me from plenty of wild-goose chases. Skipping step one and guessing the culprit is the fastest route to wasted afternoons.
How Largest Contentful Paint Relates to Other Vitals
It doesn’t live in isolation. A page that loads fast but jumps around on the user is still a bad experience.
If you fix LCP by loading a hero image early, but that image lacks explicit dimensions, you’ve just introduced layout shift. The user sees the picture pop in and shove the text downward.
Always set width and height attributes. Reserve space with aspect-ratio in CSS. The metrics should improve together, not at each other’s expense.
Balancing Loading Speed With Interactivity
Deferring scripts helps loading but can hurt interactivity if critical handlers arrive too late. The trick is separating what the user needs immediately from what can wait.
Navigation, menus, and form validation should be in the critical bundle. Chat widgets, analytics, and social embeds can load on idle or on interaction.
When the balance is right, users see content quickly and can act on it just as quickly. That’s the target.
Common Beginner Mistakes That Wreck the Metric
Let’s be blunt about the traps. These come up repeatedly in audits, and each one is easy to avoid once you know it exists.
Mistake one: optimizing an image the largest contentful paint isn’t the LCP candidate. You spend hours compressing a mid-page graphic while the hero sits untouched.
Mistake two: trusting Lighthouse alone. Lab scores flatter fast machines. Your users aren’t on your machine.
Mistake three: lazy-loading the hero. Adding loading="lazy" to the above-the-fold image delays discovery and can add a full second.
Why Lazy-Loading the Hero Backfires
Lazy loading tells the browser to hold off until the image approaches the viewport. For images already in the viewport, that instruction is actively harmful.
The browser either ignores it (wasting the hint) or defers the fetch until the layout settles (delaying render). Either way, the largest contentful paint value climbs.
Reserve lazy loading for below-the-fold images only. The hero should always load eagerly with high priority.
Tools for Measuring and Improving Largest Contentful Paint
You’ll need a small toolkit. Each tool answers a slightly different question, and using them together gives you a complete picture.
| Tool | What It Measures | Best For |
|---|---|---|
| PageSpeed Insights | Lab + field data | Quick verdict on any URL |
| Chrome DevTools Performance | Element-level detail | Deep diagnosis |
| WebPageTest | Synthetic across locations | Regional performance gaps |
| Search Console | Aggregate field data | Site-wide trends |
| CrUX Dashboard | Real-user distribution | Tracking over time |
Start with PageSpeed Insights for a snapshot. Move to DevTools for the deep dive. Confirm with field data before closing the ticket.
Reading the Diagnostic Reports
PageSpeed Insights flags opportunities in plain English: “Largest Contentful Paint element,” “Preload key requests,” “Eliminate render-blocking resources.”
Each flag links to a technical explainer. Those explainers are genuinely worth reading—they’re more detailed than most blog posts on the subject.
Don’t just apply fixes blindly. Understand why a fix works before shipping it, because the wrong fix can regress other metrics.
Mobile-First Reality: Why Devices Change the Math
Your phone is slower than your laptop. Same page, same Wi-Fi, completely different score.
Mobile devices have weaker CPUs, less RAM, and often high-latency cellular connections. The largest contentful paint element that renders in 1.5 seconds on desktop can take 3.8 seconds on a mid-tier Android device.
That’s not a bug—it’s the reality most users face. Optimize for the median device, not the flagship.
Testing on Real Devices versus Emulation
DevTools offers CPU throttling at 4x or 6x slowdown, plus network throttling to “Slow 4G.” That’s a reasonable proxy, but it isn’t perfect.
If you can, test on an actual mid-range phone. Open the page on a slow connection and watch the load with your own eyes. You’ll spot delays emulation glosses over.
The gap between emulation and reality is where most “why is my score still bad?” questions come from.
Building a Largest Contentful Paint Monitoring Habit
Performance isn’t a one-time project. It’s a habit.
Set up alerts in Search Console for Core Web Vitals failures. Add a synthetic check to your CI pipeline so regressions get caught before they reach production.
A single new marketing tag can undo months of careful optimization. Monitoring catches that within days instead of months.
Establishing a Performance Budget
Set limits. Maximum hero image size: 150 KB. Maximum total JavaScript on first load: 200 KB. Maximum TTFB: 300ms.
When a new feature breaches the budget, it doesn’t ship until it’s trimmed. That discipline preserves the largest contentful paint score across releases.
Teams that skip budgets drift downward slowly. The decline is invisible until users start complaining.
Advanced Largest Contentful Paint Tips for Stubborn Pages
Sometimes the standard fixes aren’t enough. You’ve compressed, preloaded, deferred, and cached, yet the number sits at 3.2 seconds.
At that point, dig into the render path. Are you waiting on a critical font that blocks first paint? Is a CSS-in-JS library injecting styles after hydration?
Check for layout thrashing. If JavaScript forces a reflow right as the candidate paints, the render gets pushed back.
When the Candidate is Above-the-Fold Text
Text-heavy pages have their own challenges. The candidate is often a headline rendered in a custom font, waiting on a font file fetched from a third-party origin.
Self-host the font. Preload the specific weight and subset you use. Set a fast fallback with matching metrics to avoid a jarring swap.
If the font isn’t critical to brand identity, use a system stack. It renders instantly and looks fine on nearly every device.
Frequently Asked Questions About Largest Contentful Paint
Here is an in-depth breakdown of key considerations regarding this section:
What is the Difference Between LCP and FCP?
First Contentful Paint fires when any content appears. Largest contentful paint fires when the biggest element is visible. The latter is a better proxy for perceived usefulness, which is why it replaced FCP as a Core Web Vital.
Does Largest Contentful Paint Affect SEO Rankings?
Yes, indirectly and directly. It’s a confirmed ranking signal as part of the page experience set. It also affects bounce rates, which influences how users perceive and interact with your site.
Ignoring it means leaving both technical and behavioral gains on the table.
How Often Does the Candidate Element Change?
Continuously, until the page stops loading. New candidates replace the old one whenever a larger element renders. The final candidate is what counts.
This is why late-loading images can hijack the metric even when early content looked fast.
Can JavaScript Content be the Largest Contentful Paint Element?
Text rendered by JavaScript can be a candidate, but only if the browser registers it as a block-level text node. It counts, but late hydration typically pushes the timestamp back.
What Score Should Beginners Aim for First?
Under 2.5 seconds is the target. If you’re currently above four, aim for three first, then push lower. Big jumps come from fixing the hero asset and removing render blockers, not from micro-tweaks.
Where to Go Next With Largest Contentful Paint
Mastering largest contentful paint gives you a solid footing, but performance optimization is a broader discipline.
Once you’re comfortable here, look at Interaction to Next Paint for responsiveness and Cumulative Layout Shift for visual stability. Then explore the parent topic of Core Web Vitals as a whole—and how individual metrics roll up into the score Google actually uses.
Two sub-topics worth studying next: resource hints (preconnect, prefetch, preload) and critical CSS extraction. Both directly affect how fast your primary candidate renders.
The largest contentful paint guide above gives you a foundation. Now the work is repetition—measure, fix, monitor, repeat. That habit, more than any single technique, is what separates fast sites from slow ones.