An SEO reporting dashboard turns scattered search data into a story your team can act on, and this guide breaks the whole thing down without the usual fog.
If you have ever stared at five browser tabs full of keyword tables and wondered what to actually tell your client, you already know why a clean reporting setup matters. We will walk through the foundations, then hand you seven pro tactics that separate a dashboard people trust from one they quietly ignore.
Here is the honest truth about SEO reporting: the tool is never the hard part. Focusing on SEO reporting dashboard provides clear direction here. The judgment is. Anyone can plug an API key into a template and watch numbers populate.
What takes real craft is deciding which numbers deserve a spot on the screen, how you frame a dip in traffic so it reads as information rather than bad news, and when you should stop building and start explaining.
Think of the SEO reporting dashboard article as the parent topic in a wider cluster. It sits at the center of everything from keyword tracking to backlink audits to client communication, and each of those sub-topics earns its own deep dive elsewhere.
For now, we stay focused on the dashboard itself — the single pane of glass that holds your whole search program together.
What an SEO Reporting Dashboard Actually Does
Strip away the branding and an SEO reporting dashboard is a decision-making surface. It pulls data from tools like Google Search Console, Google Analytics 4, Ahrefs, Semrush, or Moz and arranges it so a human can spot patterns quickly. The dashboard does not create insight. It removes friction so insight can happen.
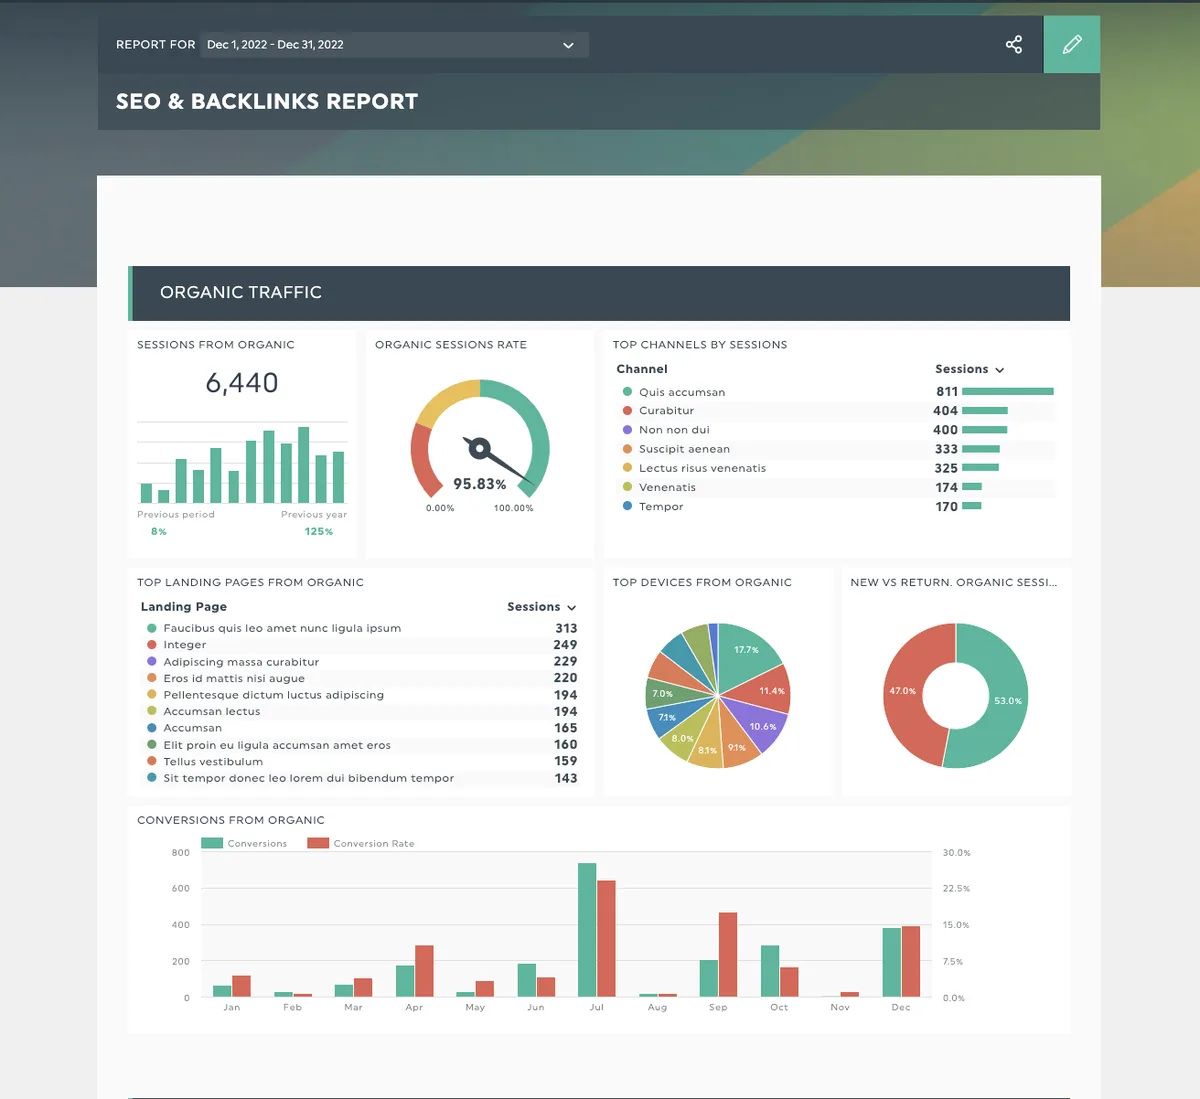
The best setups share a common trait: the SEO reporting dashboard answer a specific question the reader already has. A marketing director wants to know whether organic revenue is climbing. A content lead wants to know which pages are losing rankings.
A developer wants to know whether the site is technically healthy enough to rank at all. One dashboard cannot serve all three equally well, which is why segmentation matters from day one.
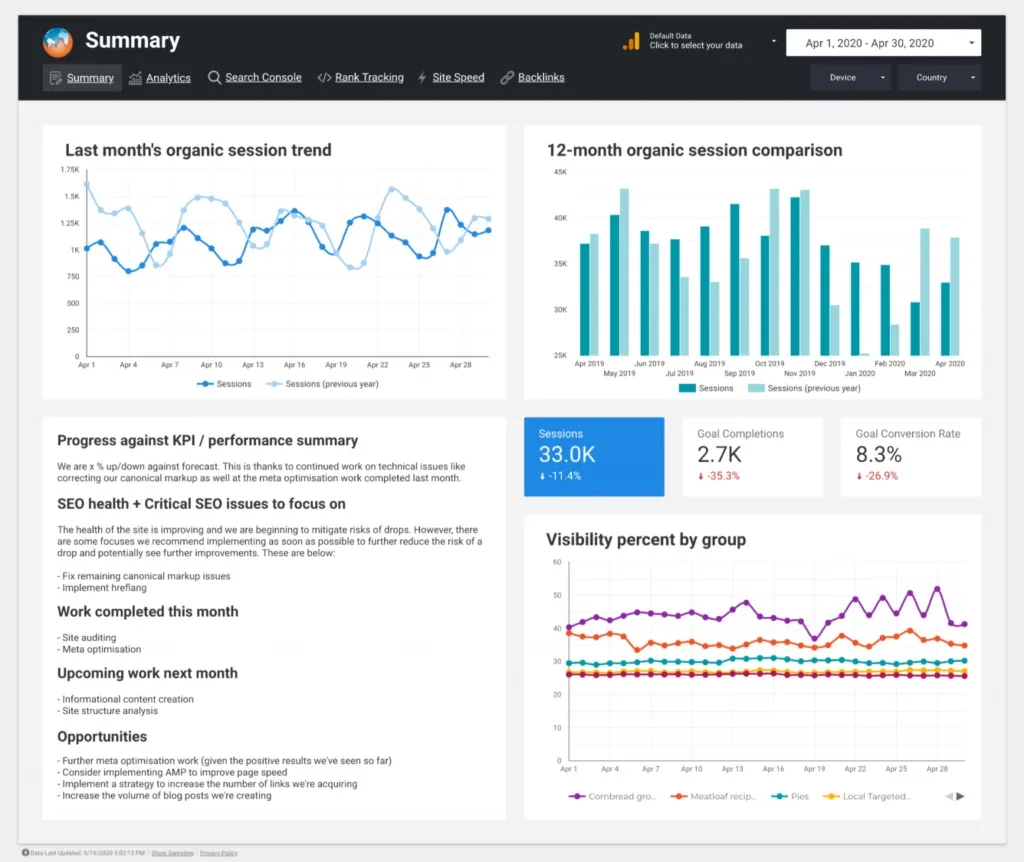
In practice, when refining a SEO reporting dashboard, most teams run two layers. There is an executive layer with four or five headline numbers, and a working layer with the granular detail the SEO team uses week to week. That split keeps everyone honest.
Executives do not get lost in crawl errors, and practitioners do not get pressured by a single vanity metric that swings on seasonality.
The Core Metrics That Belong on Every Screen
The SEO reporting dashboard will see long lists of “must-track” metrics floating around, and most of them are filler. A lean dashboard tracks organic sessions, organic conversions, average position for a defined keyword set, and indexed page count. Those four cover traffic, business outcome, visibility, and technical baseline.
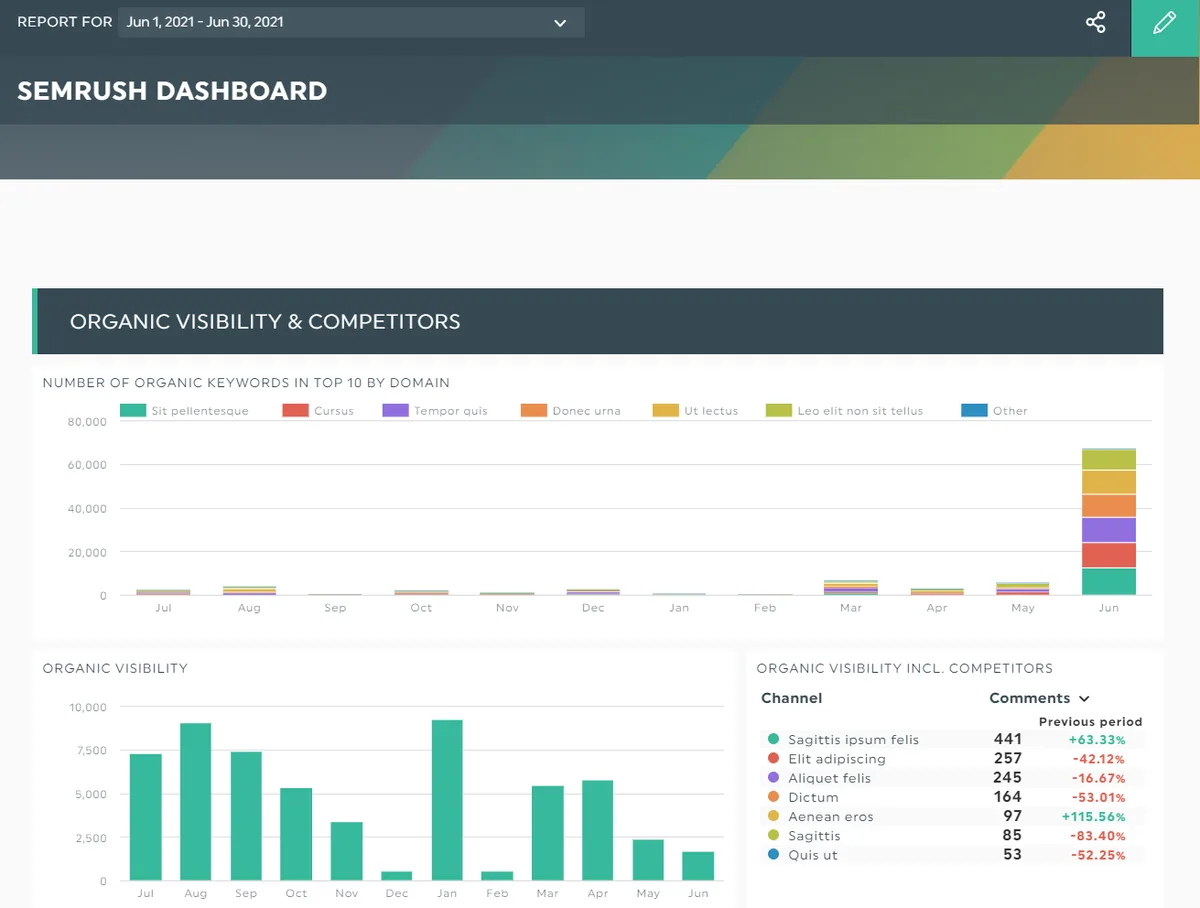
Add impressions and click-through rate from Search Console when the seo reporting dashboard want to tell a story about opportunity. A page with high impressions and low CTR is a headline or meta description problem, not a traffic problem. Spotting that distinction fast is exactly what a well-built dashboard is for.
Why Raw Data Alone Fails
Plenty of teams export a CSV, drop the SEO reporting dashboard into a slide deck, and call it reporting. The problem is that raw data forces the reader to do the analysis. When your client has thirty seconds between meetings, they will not compute a quarter-over-quarter trend in their head.
An SEO reporting dashboard does that arithmetic for them. It shows the line going up or down, annotates the reason, and leaves a takeaway. That is the difference between a data dump and reporting that earns its keep.
SEO Reporting Dashboard Guide: Choosing the Right Foundation
Before you build anything, pick your platform based on who reads the output most often. This part of the SEO reporting dashboard guide is where most teams rush and later regret it. Migrating a mature dashboard mid-quarter is painful, so a little foresight pays off.
Looker Studio (formerly Data Studio) remains the default for agencies because it is free, flexible, and connects to almost everything. Tableau and Power BI suit enterprises that already live inside those ecosystems. For lean teams, native dashboards inside Semrush, Ahrefs, or SE Ranking often do enough without a separate BI tool in the mix.
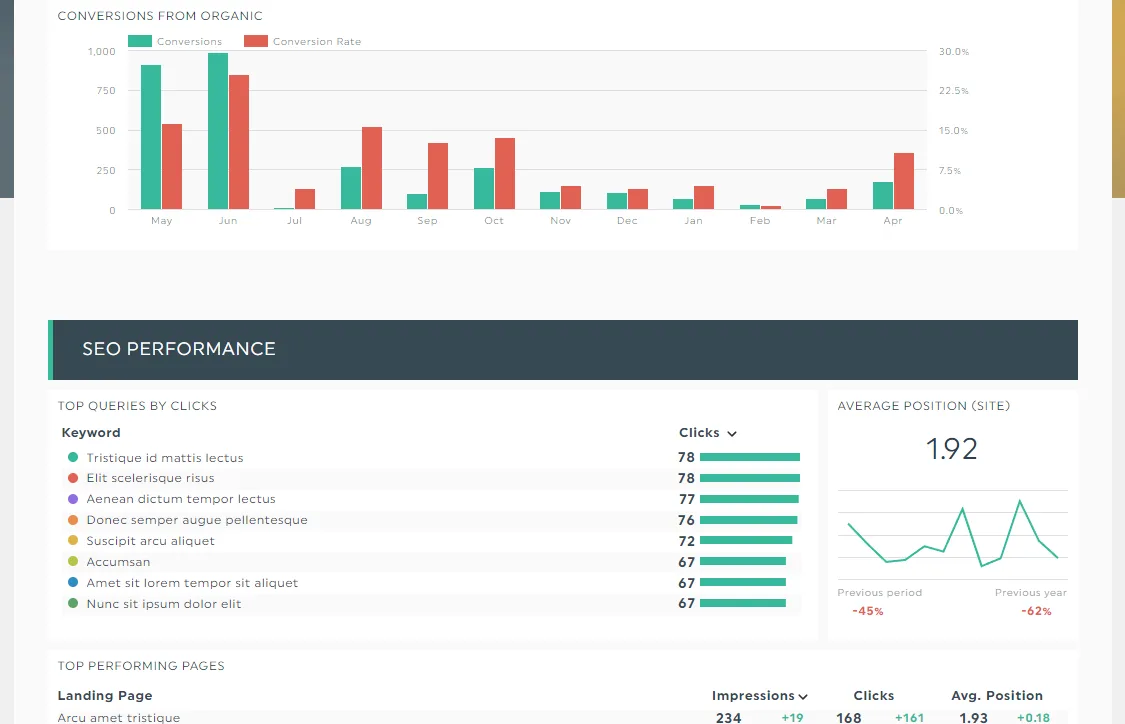
The SEO reporting dashboard is a tradeoff worth naming. Custom BI tools give you tailored views but demand maintenance. Native tool dashboards are turnkey but locked to that vendor’s data definitions. A hybrid approach — one native dashboard for daily work, one custom dashboard for stakeholders — tends to age well.
Connectors and Data Sources That Matter
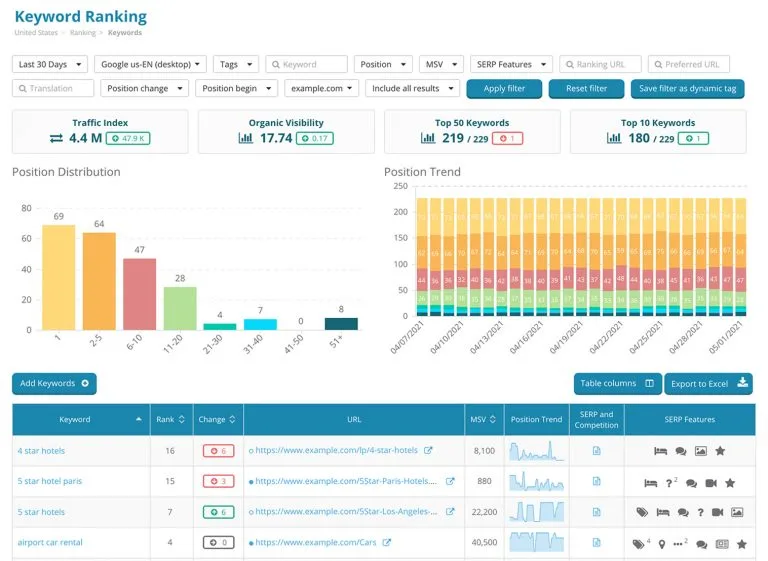
The quality of your reporting depends on the pipes feeding it. Search Console gives you query-level data and index status. Analytics tells you what happened after the click. A rank tracker fills in position history over time. A backlink tool rounds out authority signals.
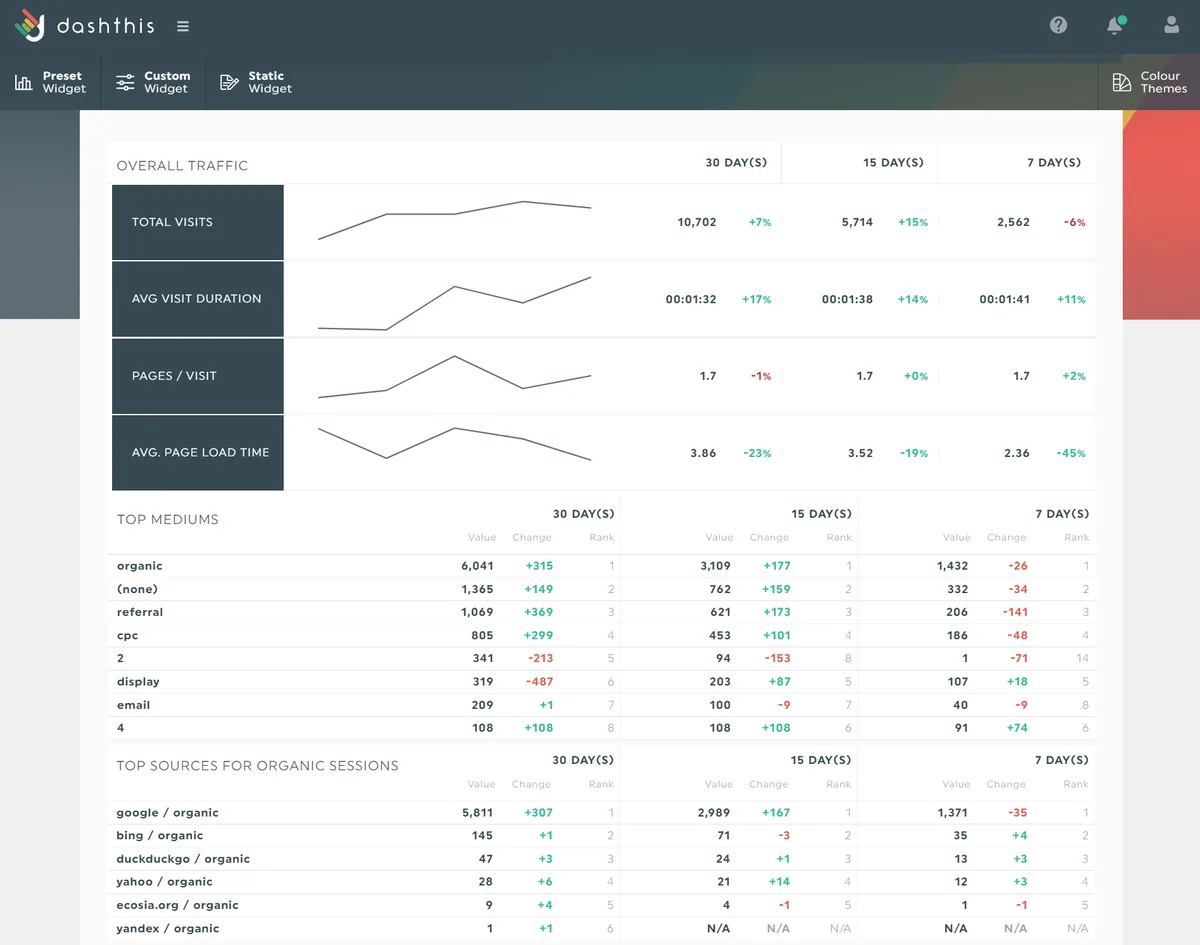
Do not connect sources just because the SEO reporting dashboard can. Every extra connector adds latency and a potential point of failure. Map each source to a specific metric first, then wire it in. That discipline keeps load times fast and dashboards readable.
Setting a Refresh Cadence You Can Trust
Daily refreshes feel impressive but often create noise. Search data itself updates on a delay, so a live-looking number can mislead. Weekly refreshes align better with how SEO actually moves.
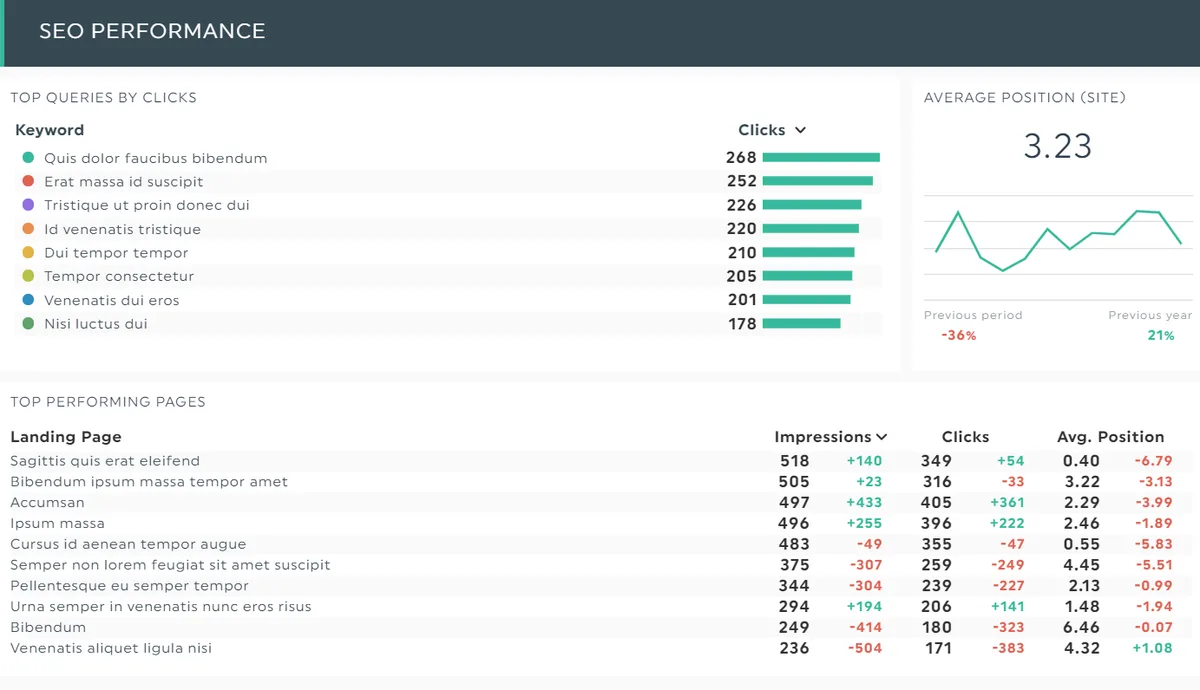
For volatile metrics like rankings, a daily view helps catch sudden drops, but the commentary should stay weekly. Developing your SEO reporting dashboard with precision highlights key strengths. Blend the two: automate the data, humanize the narrative. Your reader should never wonder whether a number is fresh.
The SEO Reporting Dashboard Checklist Before You Share
A simple pre-flight check saves embarrassment. This SEO reporting dashboard checklist covers the basics teams forget when they are deep in build mode. Run it every time before a dashboard goes live or gets sent to a new audience.
- Every chart answers a question. If you cannot state the question out loud, delete the chart. Decorative graphs dilute attention.
- Date ranges are explicit. Show the comparison period — month over month, year over year — right beside the metric, not buried in a filter.
- Definitions are documented. A glossary tab explaining terms like “organic sessions” or “assisted conversion” prevents three people reading the same number three ways.
- Filters work and are obvious. Test that a date or device filter changes every relevant chart, not just one.
- Mobile view is checked. Most executives glance at reports on a phone. A dashboard that shatters on small screens loses half its audience.
- Annotations are in place. A ranking dip during a site migration needs a note, or someone will assume the worst.
- Access permissions are set. Share only what is needed, especially if the dashboard contains revenue figures.
Run the seo reporting dashboard list, and you will catch ninety percent of the issues that turn a report into a support ticket. The remaining ten percent usually comes down to context you cannot automate — an algorithm update, a PR event, a holiday lull.
Seven Pro Tactics for a Dashboard People Actually Use
Now to the heart of the SEO reporting dashboard guide. These seven tactics come from watching dozens of dashboards succeed and, frankly, many more fail. Each one addresses a specific reason readers tune out or misread the data.
1. Lead With Revenue, Not Rankings
Rankings are a means, not an end. When your first slide shows a slip in average position, the room panics. When it shows organic revenue holding steady despite a ranking dip, the room listens. Lead with the business outcome, then explain the search story behind it.
The SEO reporting dashboard single change reframes every conversation. Stakeholders stop asking “why did we drop four places?” and start asking “how do we protect the revenue we have?” That is a far more productive question, and it keeps SEO funded when budgets get tight.
2. Segment by Intent, Not Just by Channel
A single “organic traffic” line hides more than it reveals. Break organic sessions into informational, commercial, and transactional buckets. Transactional traffic slipping while informational traffic grows is a completely different story than an overall decline.
ClearScope and Surfer-style content tools already map keywords to intent, so the SEO reporting dashboard often have the data sitting there. Pipe it into the dashboard and watch how differently the team responds. Intent segmentation turns a flat line into a diagnosis.
3. Build an Annotation Layer Over Every Chart
A chart without context is a riddle. Google Search Console and most BI tools let you add notes tied to a date. Use them. Mark the day you published a new pillar page, the day a competitor launched a big campaign, the day an algorithm update rolled out.
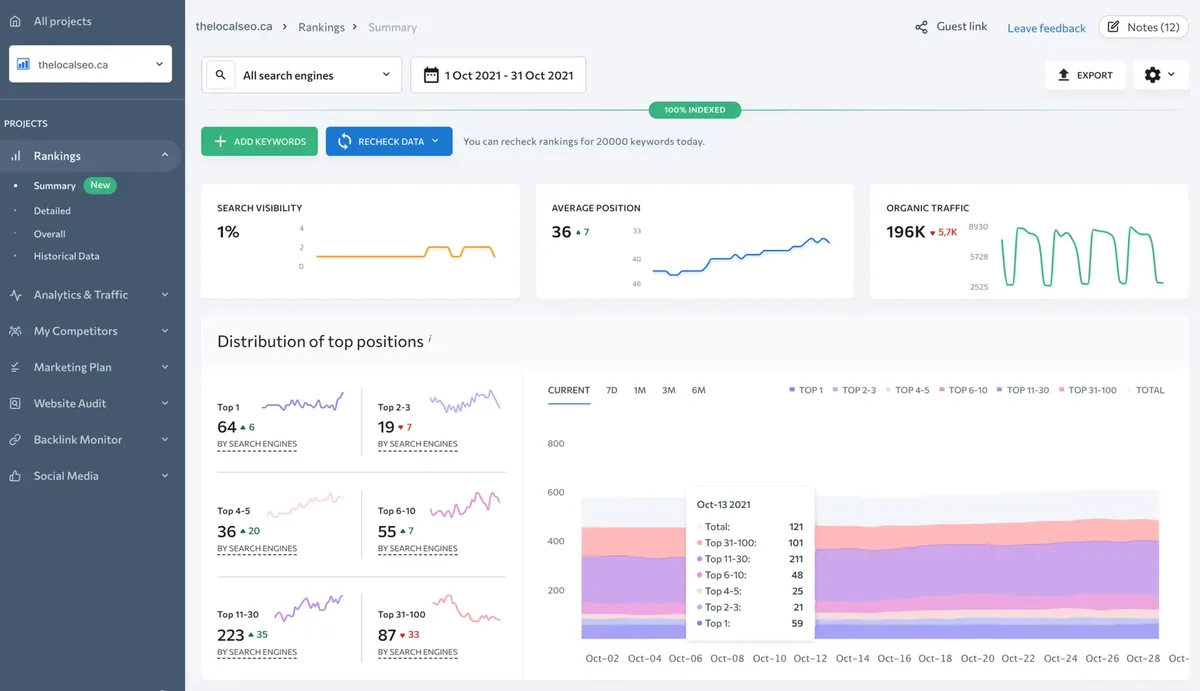
Six months later, the SEO reporting dashboard annotations become an institutional memory. New team members can read the history instead of asking the same questions. That alone makes the annotation habit worth the five extra minutes a week.
4. Track Keyword Clusters, Not Lone Keywords
Individual keyword tracking is a relic. Effective execution in your seo reporting dashboard makes a tangible difference. Modern searchers move within topics, so your reporting should follow topics too. Group related keywords into clusters and report on the cluster’s combined visibility.
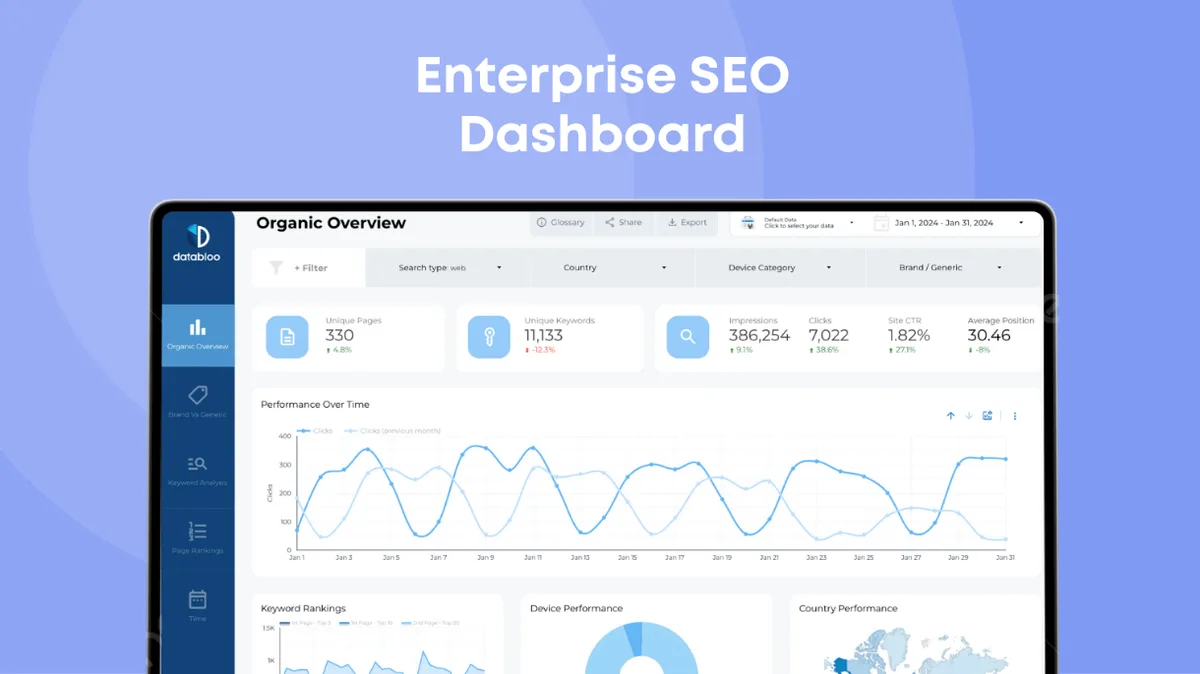
When you manage five hundred keywords as twenty clusters, patterns emerge instantly. One cluster can lose ten keywords and still climb in overall visibility — a nuance a keyword-level view would miss and misreport. Clustering is also how you build topical authority, so the reporting reinforces this SEO reporting dashboard strategy.
5. Create a Landing Page Scorecard
Instead of tracking site-wide averages, give your top twenty or thirty landing pages their own report. For each page, show organic sessions, conversions, average position for its primary keyword, and internal links pointing to it.
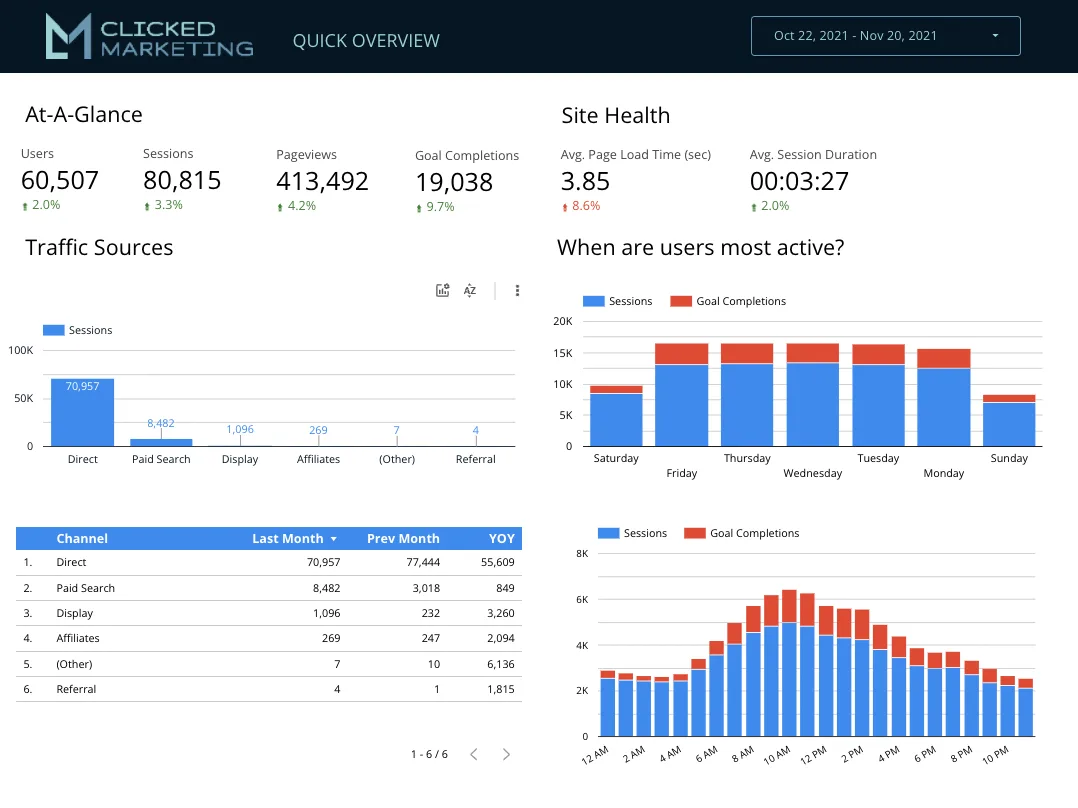
The SEO reporting dashboard scorecard quickly reveals the pages doing the heavy lifting and the ones quietly underperforming. A page ranking well but converting poorly is a content problem. A page converting well but barely ranking is a link-building opportunity. The scorecard separates the two.
6. Automate Alerts So You Report on News, Not History
The most useful reporting happens between scheduled reviews. Set alerts for organic traffic drops greater than fifteen percent week over week, sudden ranking losses on core keywords, or spikes in crawl errors. When an alert fires, your team reacts in hours instead of discovering it at the next monthly meeting.
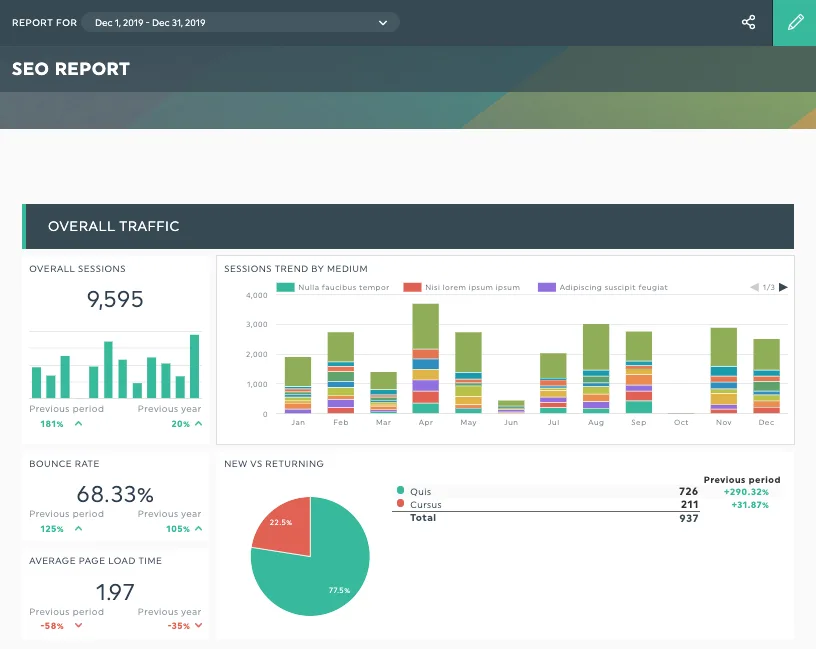
Alerts also reduce reporting fatigue. Maintaining clarity across your SEO reporting dashboard remains essential. When you only discuss anomalies, every meeting has genuine content. The regular numbers can ride along in a digest nobody has to defend.
7. Always End With a Recommendation
Every report needs a next step. A dashboard that ends in a table forces the reader to figure out what to do. A dashboard that ends in “shift two writers toward the comparison cluster” or “fix the broken canonical tags on forty pages” creates action.
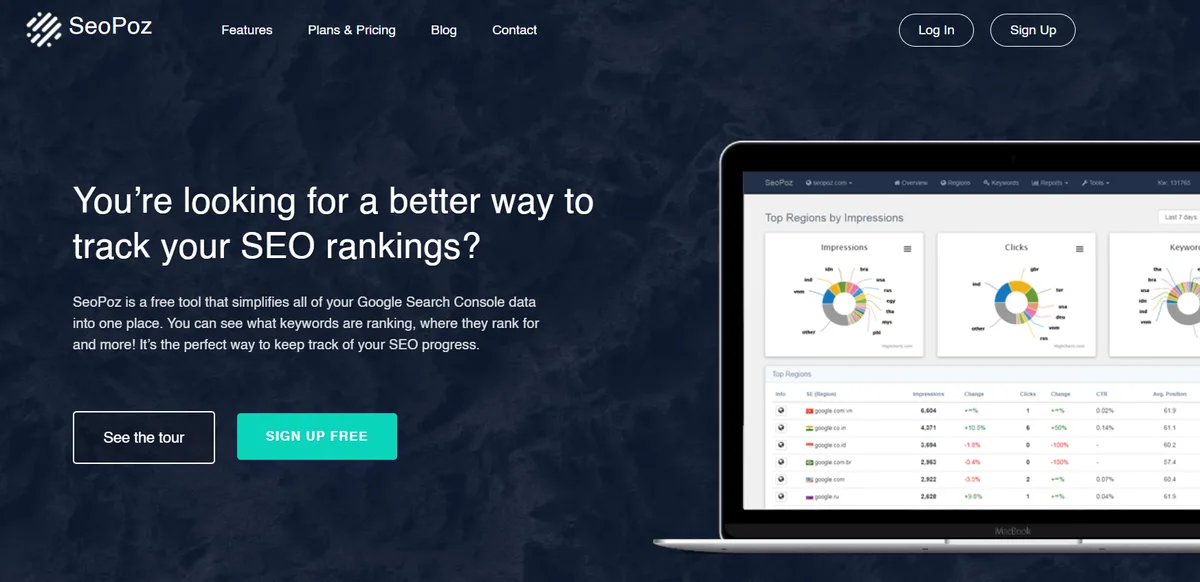
This is where an SEO reporting dashboard proves its value. It is not a mirror reflecting what happened; it is a compass pointing where to go. Make the recommendation explicit, and you will find your reports get read to the last line.
SEO Reporting Dashboard Best Practices for Teams That Scale
Small teams can be informal. Once you cross a certain size, though, these SEO reporting dashboard best practices become non-negotiable. They keep reporting consistent when several people touch the same account.
Start with a naming convention for every chart and metric. A thoughtful approach to SEO reporting dashboard reinforces your qualifications. “Organic Sessions (GA4, excluding brand)” is far better than “Traffic.” Standardization prevents the chaos that creeps in when five analysts each label things their own way.
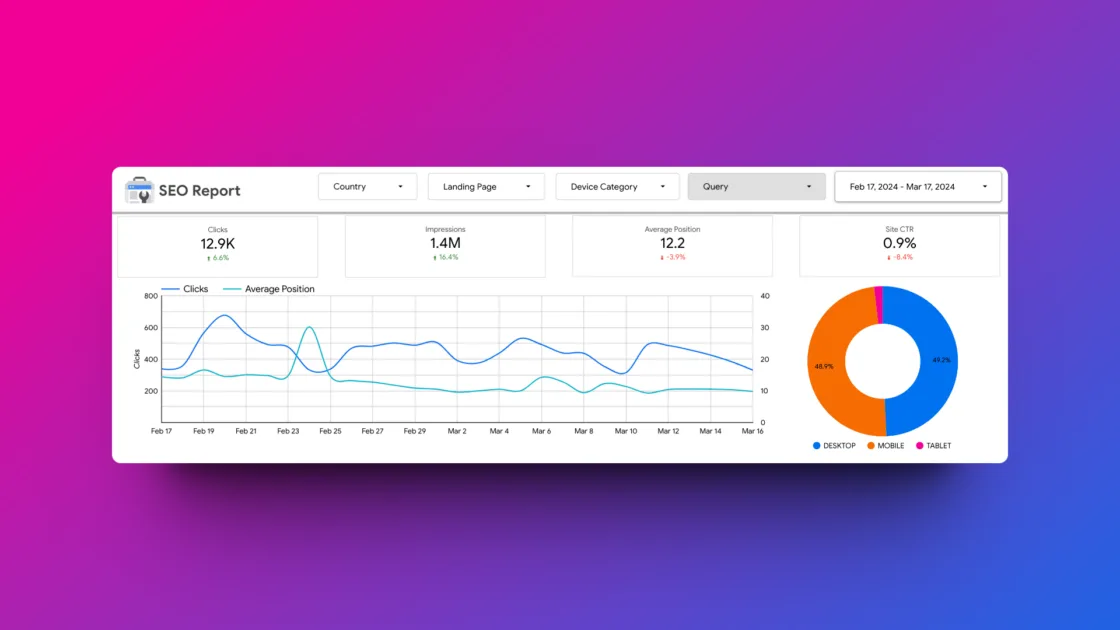
Then assign ownership. Maintaining clarity across your seo reporting dashboard remains essential. Every dashboard section should have a name next to it — the person responsible for keeping it accurate. Shared ownership of a report usually means nobody owns it, and stale data is worse than no data.
Keep Data Definitions in One Place
A shared glossary is the unglamorous hero of good reporting. Structuring your SEO reporting dashboard around proven patterns ensures impact. When the glossary lives beside the dashboard, disagreements about numbers shrink dramatically. Two teams looking at “conversions” will finally agree on whether they mean GA4 key events or form submissions.
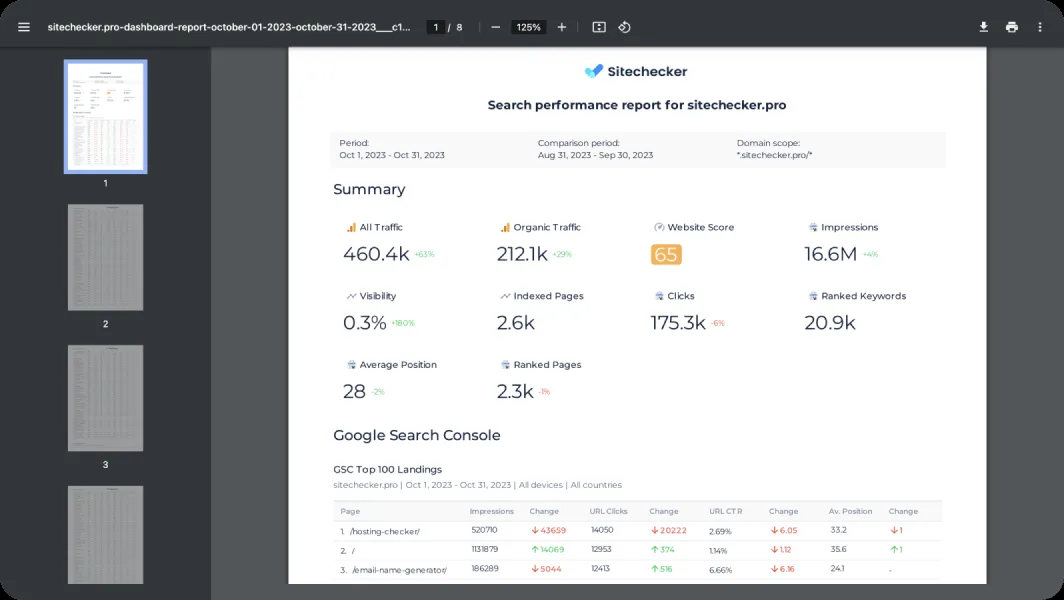
Document conversion windows, attribution models, and filters too. These details rarely make the headline slide, but they determine whether the headline slides tell the truth.
Standardize the Cadence Across Accounts
If the SEO reporting dashboard manage multiple clients or brands, a consistent cadence makes life easier for everyone. Weekly internal checks, monthly client reports, quarterly strategy reviews. Each frequency has a different audience and a different level of detail.
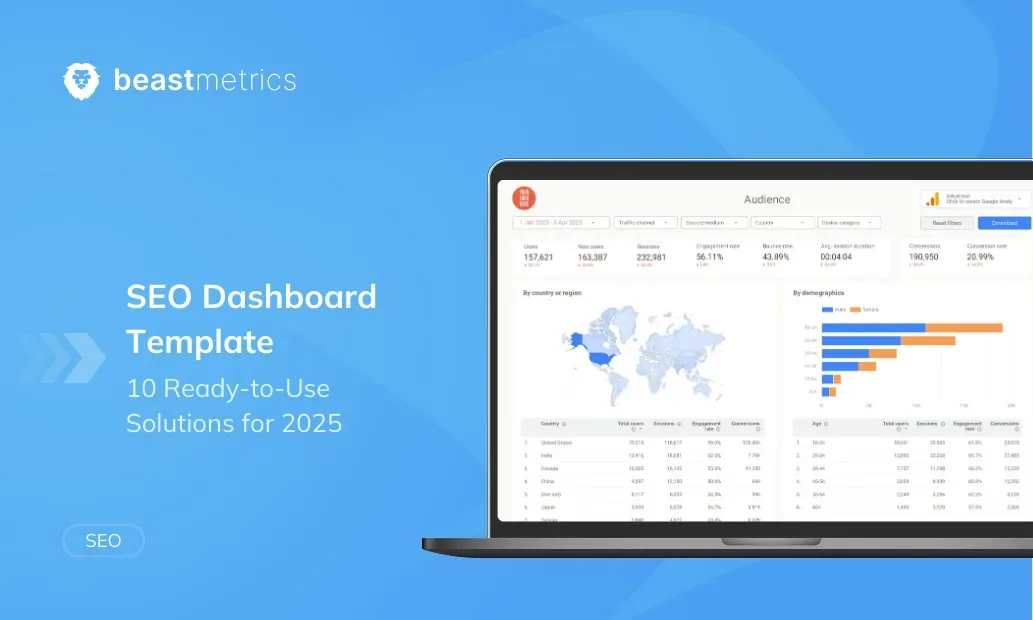
The monthly client report should be tight and visual. The quarterly review can go deeper into trends and hypotheses. Keeping these three rhythms aligned means you are never scrambling to build something from scratch twice.
SEO Reporting Dashboard Tips for Specific Roles
Not everyone reads a report the same way, so these SEO reporting dashboard tips focus on adapting the output to the person on the other side of the screen. One dashboard, many audiences — but the first view should match the role.
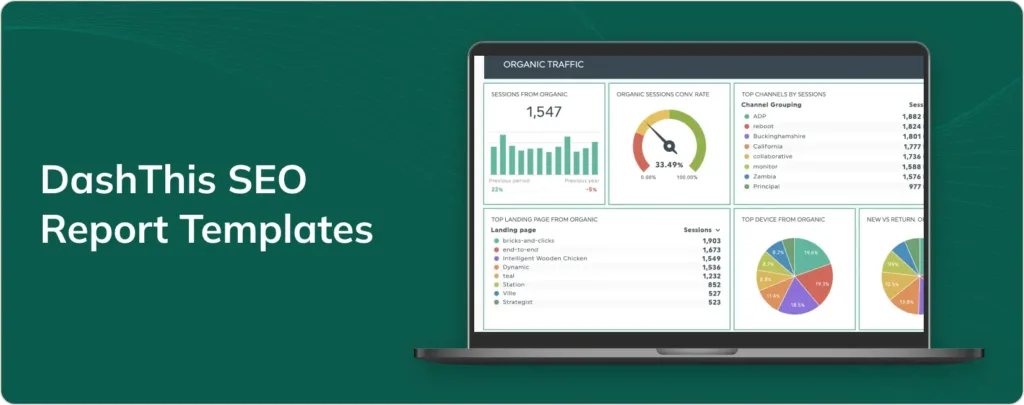
For the CMO, open with organic revenue, pipeline contribution, and one clear narrative. Proper attention to your SEO reporting dashboard sets a strong baseline. For the content lead, surface keyword clusters, traffic by page, and pages losing visibility. For the developer, prioritize crawl errors, index coverage, and Core Web Vitals. Same data, three entry points.
Pair each view with a summary sentence the reader can copy into their own report. That single courtesy — giving them the takeaway in advance — builds enormous goodwill. It also ensures your interpretation travels with the data, reducing the risk of someone reading raw numbers out of context.
How to Report a Traffic Drop Without Panic
The single most common reporting challenge is a traffic drop. A thoughtful approach to seo reporting dashboard reinforces your qualifications. Frame it in this order: what happened, why it happened, what we already know, what we are doing about it, and when we will know more. Five sentences, no drama.
Compare against the appropriate baseline. A year-over-year comparison may look flat while a two-week spike against a recent high looks alarming. Choosing the right comparison is half the craft. And always separate a real decline from a seasonality or tracking glitch — the latter two account for more “drops” than most teams expect.
Comparing Popular Dashboard Platforms
The right tool depends on your team’s size and technical appetite. Below is a pragmatic comparison of the platforms teams reach for most often when they build an SEO reporting dashboard. Treat it as a starting point, not a verdict — your use case decides.
| Platform | Best For | Cost Model | Standout Strength |
|---|---|---|---|
| Looker Studio | Agencies, lean teams | Free, with paid connectors | Flexibility and wide integrations |
| Google Search Console | Everyone with a website | Free | Authoritative query and index data |
| Semrush | In-house SEO teams | Subscription | All-in-one data, native dashboards |
| Ahrefs | Link-heavy strategies | Subscription | Backlink depth and keyword research |
| SE Ranking | Small agencies | Subscription | Value pricing and client reports |
| Tableau | Enterprises | Enterprise licensing | Deep visualization and governance |
| Power BI | Microsoft-centric orgs | Enterprise licensing | Tight integration with internal data |
Notice the SEO reporting dashboard the strongest combination is usually two tools, not one. Search Console for truth about search data, and a BI layer for presentation. The BI layer can be swapped; the underlying source of truth cannot.
Common Mistakes That Undermine SEO Reporting
Even a beautiful dashboard can mislead if the process behind it is sloppy. These mistakes show up again and again, and each one is fixable with some discipline.
- Vanity metrics without context. A rising average position means little if the underlying keyword set changed. Show the keyword set on the same screen.
- Inconsistent date ranges across charts. A chart showing thirty days next to one showing ninety creates false comparisons. Standardize the window or label it loudly.
- Ignoring brand versus non-brand. Branded traffic inflates overall numbers and hides the health of the non-brand acquisition engine. Split them.
- No baseline. Reporting a number without a previous period, target, or benchmark leaves the reader unable to judge whether it is good or bad.
- Over-automation without review. Scheduled exports that nobody checks will eventually contain errors. A five-minute weekly review prevents that.
- Treating context as optional. The number is only half the message. Without the “why,” the reader guesses, and guesses are usually wrong.
Each of these mistakes has the same root cause: confusing activity with insight. Fixing it usually requires deleting elements, not adding more. The best dashboards are ruthlessly edited.
Frequently Asked Questions About Reporting Dashboards
The seo reporting dashboard are the questions that come up in almost every kickoff call. Answering them up front saves a lot of back-and-forth later.
How Often Should You Update the Dashboard?
Weekly is the sweet spot for most teams. Search data itself has a delay, so a daily refresh can create false drama. Weekly updates give enough signal without noise, while alerts handle the urgent cases in between.
Can You Build a Dashboard Without Paid Tools?
Yes. Google Search Console and Google Analytics 4 are free, and Looker Studio connects to them at no cost. You can build a genuinely useful SEO reporting dashboard on zero budget, though you will sacrifice some keyword and backlink depth that paid tools provide.
What Should be on the First Screen?
Lead with organic revenue or organic conversions, then organic sessions, then a trend line for your core keyword cluster. If the reader only sees the first screen, those three tell the essential story. Everything below is supporting evidence.
How Do You Handle Data Discrepancies Between Tools?
Pick one source of truth per metric and stick to it. Search Console and Analytics will never match perfectly because they measure different things — sessions versus clicks. Documenting that difference in your glossary prevents endless debates.
Do Dashboards Replace Written Reports?
No. Applying these principles to your seo reporting dashboard yields measurable results. The dashboard shows what happened; the written summary explains why it matters and what comes next. Teams that skip the narrative end up with pretty numbers and no decisions. The annotation habit from our pro tactics helps bridge the two.
Pulling It All Together
A well-built SEO reporting dashboard is really an argument made visible. Each chart supports the claim that search is working — or reveals that it is not, with enough detail to fix it. Approach the build with that mindset, and the layout decisions become easier.
Start simple. Pick your source of truth, define your core metrics, and build around the questions your audience actually asks. Then layer in the seven tactics one by one, measuring which ones change behavior. A dashboard nobody acts on is just an expensive spreadsheet with nicer fonts.
The final word is about restraint. Your best reporting will not come from cramming every metric into one screen. It comes from deciding what to leave out. Do that well, and the numbers on your dashboard will stop being noise and start being a direction.
If you take one habit from everything above, make it the recommendation slide. End every report with what should happen next. That single sentence turns an observer into a decision-maker, and turns your dashboard into the most valuable tab open on your client’s browser.
For verified reference and background research, consult the authoritative informational resource on this topic.