A marketing metrics dashboard only earns its keep when it changes what you do on Monday morning. That single idea drives every tip below. If your dashboard looks impressive in a meeting but nobody opens it before making a decision, you don’t have a measurement system — you have wallpaper.
I’ve spent years building and tearing down these dashboards for teams of every size, from two-person startups to marketing departments with more channels than they can count. The pattern is always the same: the tool is rarely the problem.
The thinking behind the metrics is. So this marketing metrics dashboard guide skips the software demo and goes straight to the judgment calls that separate a dashboard people trust from one they quietly ignore.
Eleven tips follow, grouped into the phases where they matter most. Read them in order if you’re building from scratch, or jump to your marketing metrics dashboard section that matches your current headache. Either way, treat this as a working checklist rather than a one-time read.
Why Most Marketing Metrics Dashboards Fail Before They Launch
Here’s the uncomfortable truth I’ve watched play out dozens of times: dashboards fail at the whiteboard, not at the screen. Focusing on marketing metrics dashboard provides clear direction here. Someone lists every metric the team can access, wires them into a grid, and calls it measurement. Three weeks later, no one’s looking.
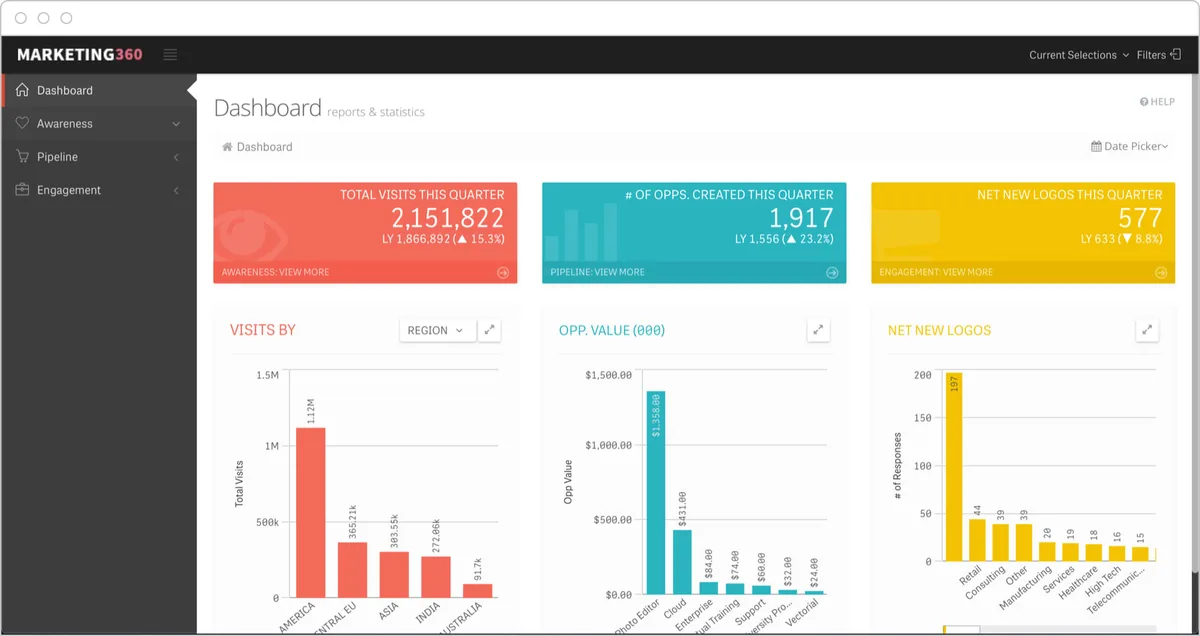
The root cause is almost always the same. A dashboard built to prove activity is not the same as a dashboard built to drive decisions. Activity dashboards answer “what happened?” Decision dashboards answer “what should we do next?” Most teams build the first and wonder why it collects dust.
Before you touch a single chart, you need a thesis. What decisions will this marketing metrics dashboard support? Who opens it, how often, and what will they change based on what they see? If you can’t answer those three questions in plain language, stop building and start asking.
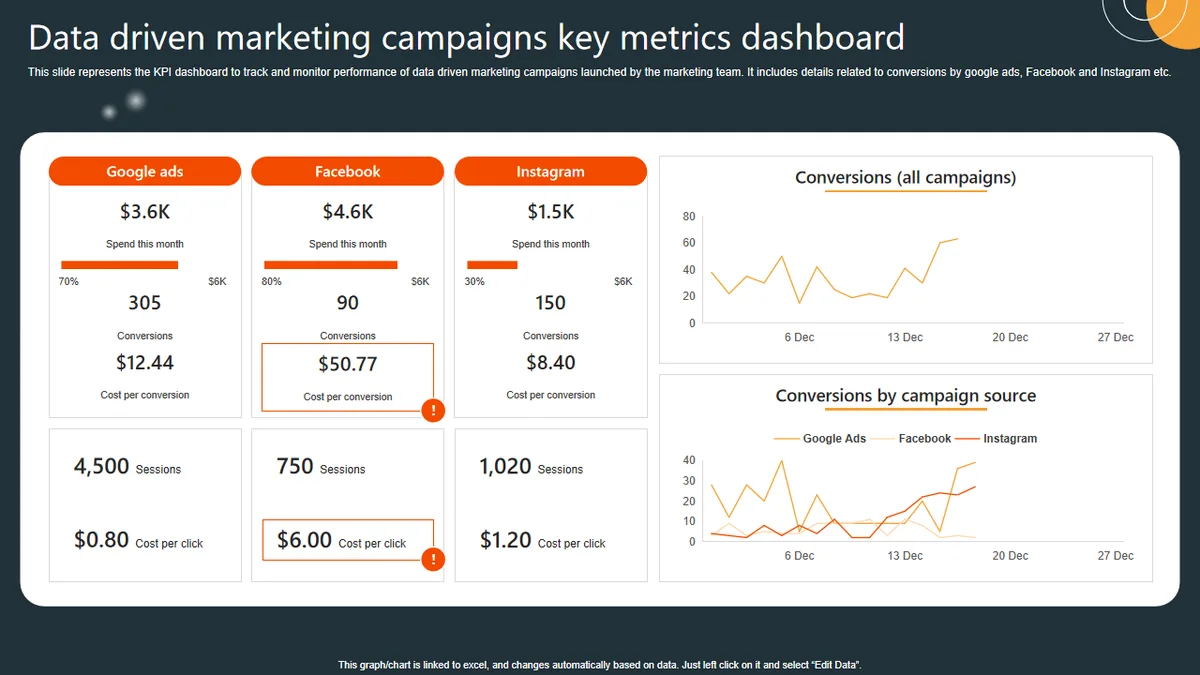
This is the foundation of any serious marketing metrics dashboard best practices conversation, and it’s the step nearly everyone skips. The tips below assume you’re willing to do that hard thinking first. If you are, everything else gets easier.
The Foundation: Getting Your Marketing Metrics Dashboard Right from Day One
The first four tips handle the groundwork. Skip them and you’ll spend months rebuilding what you should have built correctly the first time. Get them right and the rest of the work compounds.
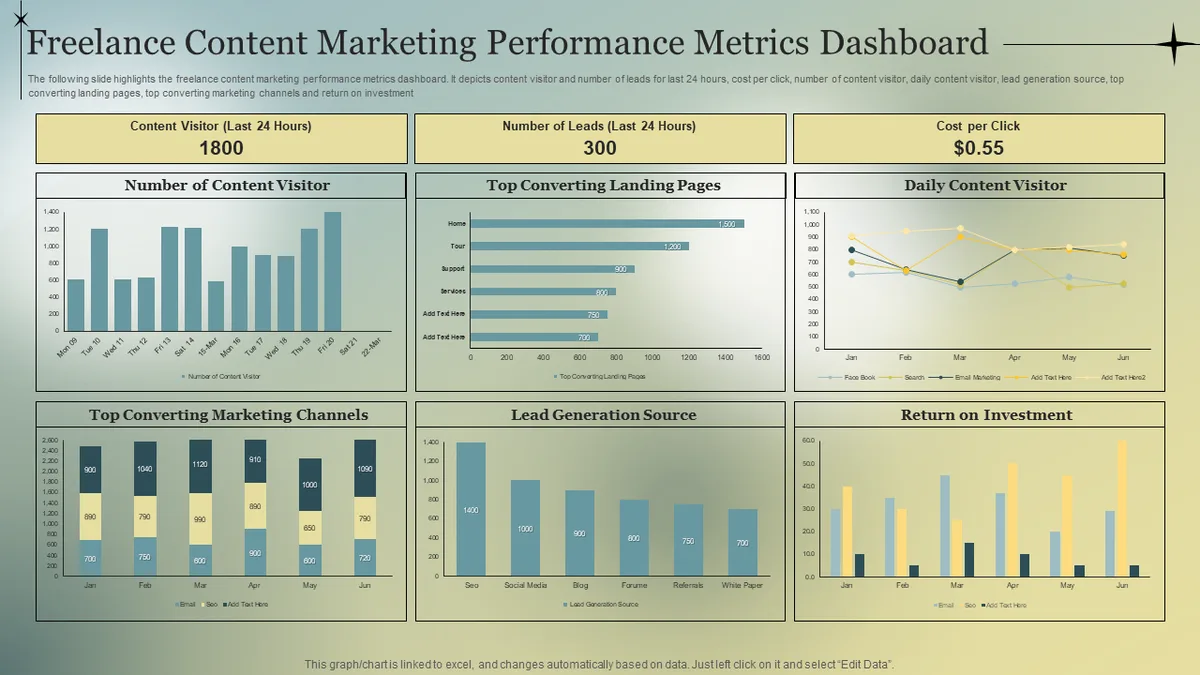
1. Start With the Decision, Then Work Backward to the Metric
Every metric on your dashboard should earn its spot by answering a specific question someone actually asks. Not “wouldn’t it be nice to track this?” but “what will we do differently if this number moves?”
I use a simple test. For each proposed metric, write down the decision it informs. If you can’t name a real decision — a budget shift, a campaign pause, a creative swap — the metric doesn’t belong on the top layer. It might belong in a deeper drill-down, but not on the surface.
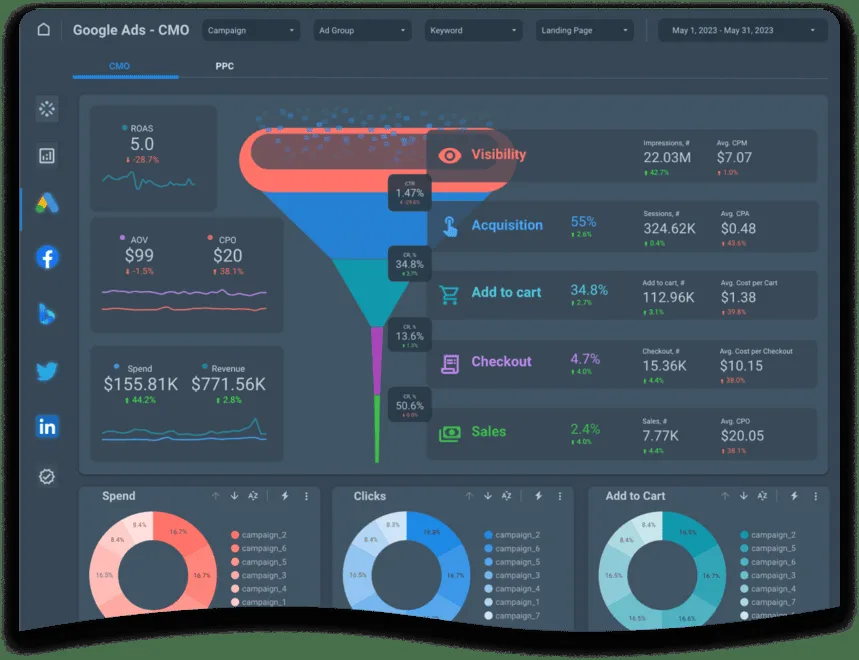
Take a common example. A team tracks “total social impressions” because it’s easy to pull. But what decision does that drive? Almost none. Swap it for “impressions per dollar by channel” and suddenly you’re comparing efficiency, which actually informs where next month’s budget goes.
The marketing metrics dashboard single habit — decision first, metric second — will cut your dashboard from forty numbers to eight meaningful ones. And eight numbers people trust beats forty they scroll past.
2. Separate Leading Indicators from Lagging Results
Revenue is a lagging indicator. It tells you what already happened. By the time your marketing metrics dashboard shows a revenue dip, the cause is weeks old and the fix is expensive.
Leading indicators are the early signals — email click-through, trial signups, demo requests, content engagement depth. They move before revenue does, which gives you time to react. A dashboard without leading indicators is a rearview mirror.
The practical move: pair every lagging metric with one or two leading metrics the marketing metrics dashboard historically predict it. If your team knows that a certain demo-request volume reliably converts to pipeline within a quarter, that leading number becomes your early warning system.
I’ve seen teams catch a channel collapse six weeks early because they watched qualified traffic trends instead of waiting for the revenue report. That’s the whole point of a forward-looking marketing metrics dashboard.
3. Pick One North Star Metric and Defend It
Dashboards fragment when every stakeholder adds their favorite number. The fix is a single north star metric that captures the core value your marketing delivers — and a firm commitment to keep it stable.
Your north star isn’t revenue (too broad) or clicks (too shallow). It’s the one number that, if it grows, the business grows. For a subscription product, it might be activated trials. For a lead-gen business, marketing-qualified leads. For e-commerce, repeat purchase rate.
Once chosen, everything else on the dashboard exists to explain movements in that north star. When a stakeholder asks to add a metric, the question becomes: “Does this help us understand the north star?” If not, it waits.
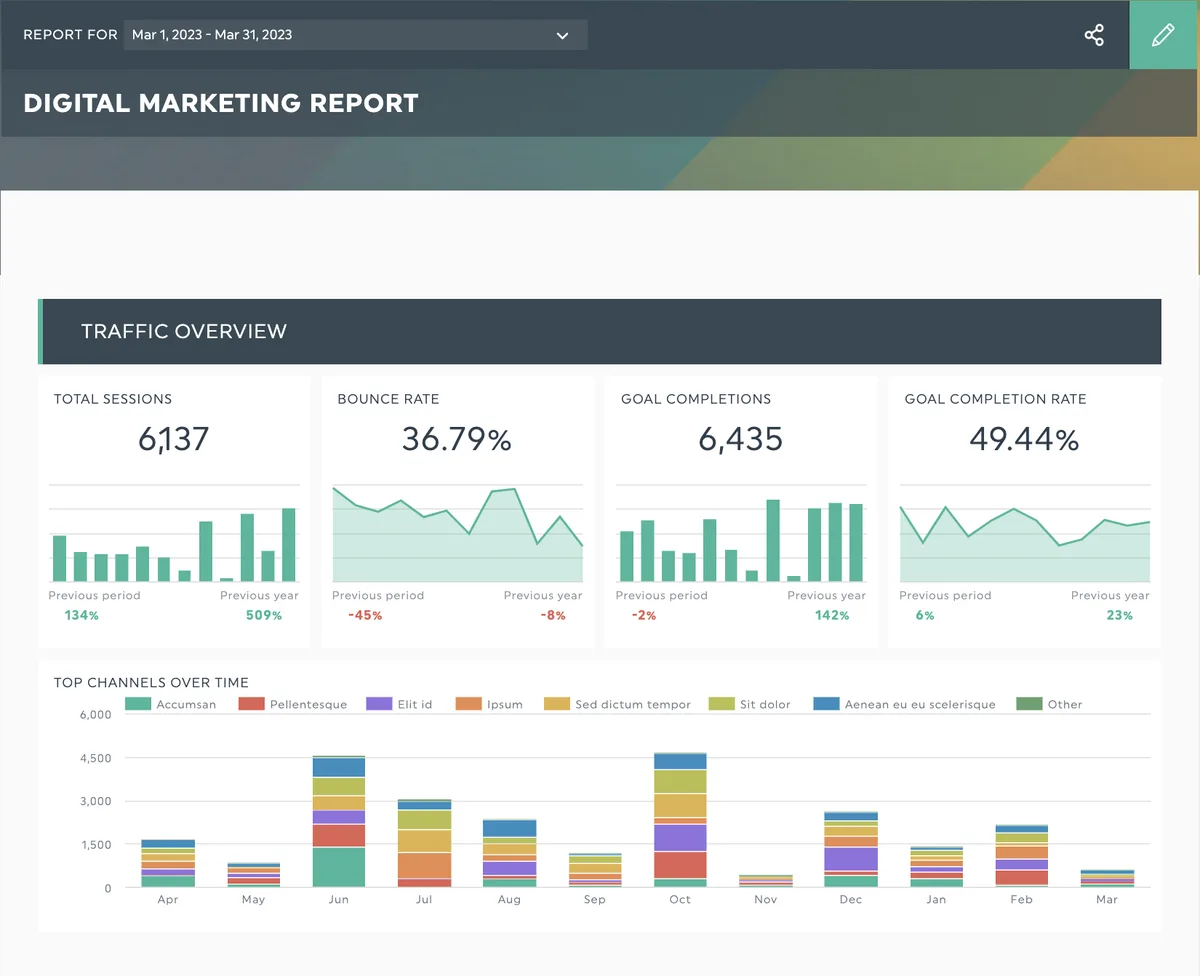
Defending the north star is political work, not technical work. But a marketing metrics dashboard with one clear hero number is dramatically easier to read, trust, and act on than one with five competing priorities.
4. Build a Metric Dictionary Everyone Actually Reads
Half of all dashboard arguments are definition arguments in disguise. Two people look at the same “conversion rate” and see different numbers because one counts form fills and the other counts qualified leads.

A metric dictionary fixes this. Effective execution in your marketing metrics dashboard makes a tangible difference. It’s a plain document listing every metric on the dashboard, its exact formula, its data source, and its owner. No jargon, no ambiguity. When someone asks “why did this change?”, the dictionary answers “what is this?” first.
Keep it short and human. A one-line definition beats a paragraph. “Conversion rate = qualified leads ÷ sessions, source: CRM matched to analytics, owner: demand gen lead” is all you need.
This is one of those marketing metrics dashboard tips that feels boring until the first cross-team meeting where two departments confidently cite different numbers for the same thing. After that meeting, everyone becomes a dictionary believer.
Building the Right Marketing Metrics Dashboard Structure and Data Layer
Now we get into the mechanics. These three tips cover how the dashboard is organized, how the data flows into it, and how you keep it trustworthy over time. Structure is where good intentions meet messy reality.
5. Layer Your Dashboard: Overview, Channel, and Drill-Down
A flat dashboard forces everyone to wade through detail the marketing metrics dashboard don’t need. A layered one lets each audience start where they should and dig only when they want to.
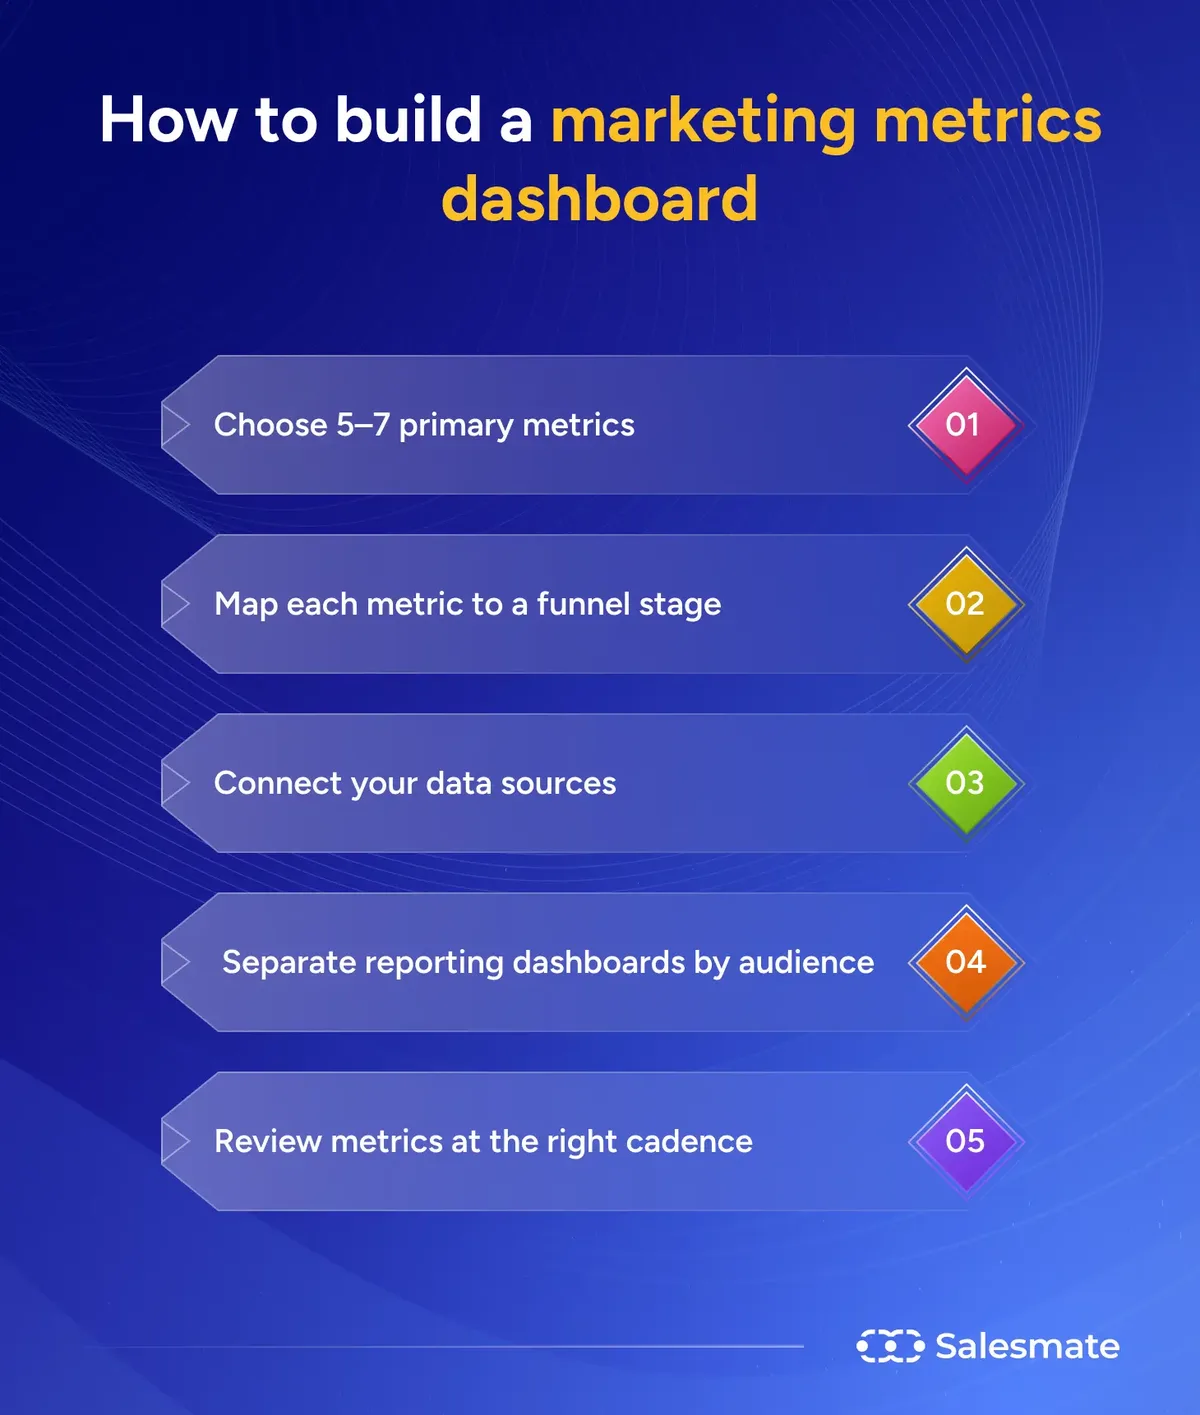
The top layer is the executive overview — five to seven numbers, north star included, updated on a regular cadence. The middle layer breaks performance down by channel or campaign. The bottom layer is raw detail for analysts who need to investigate anomalies.
This structure respects different attention spans. A CMO wants the top layer in thirty seconds. A channel manager lives in the middle. An analyst needs the bottom. One marketing metrics dashboard, three views, zero wasted scrolling.
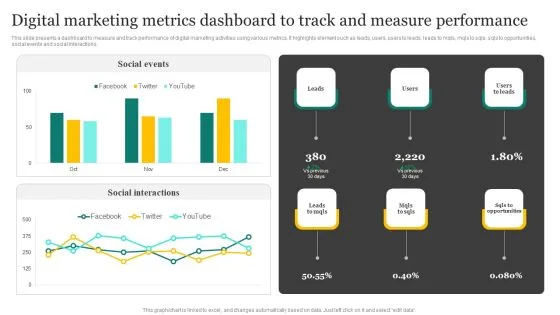
Build the layers in that order, top-down. It forces you to decide what truly matters before you get lost in granularity. And it keeps the overview honest — if a number doesn’t survive the cut to the top layer, it probably wasn’t that important.
6. Automate the Data Pull, but Audit It Monthly
Manual data entry is where dashboards go to die. Someone forgets to update a spreadsheet, a number goes stale, trust erodes, and the dashboard loses its audience. Automate the pull wherever you can.

But automation creates its own trap: silent failure. Maintaining clarity across your marketing metrics dashboard remains essential. A tracking pixel breaks, an API changes, a filter gets misconfigured, and the dashboard keeps showing confident, wrong numbers. Nobody notices until a decision goes sideways.
Set a monthly audit habit. Spot-check a handful of metrics against source data. Confirm the numbers reconcile. It takes an hour and catches the failures that automation hides.
I keep a simple rule for every marketing metrics dashboard I maintain: if I can’t trace a number back to its source in under five minutes, it’s not ready for the top layer. Traceability is trust.
7. Design for the Mobile Glance, Not the Desktop Stare
Most dashboard viewing happens in stolen moments — a phone check between meetings, a quick scan before a call. If your dashboard only works on a big screen with a mouse, you’re designing for a viewing habit that barely exists anymore.
Prioritize the top layer for small screens. Big numbers, clear labels, obvious trends. Save the dense tables and multi-series charts for the drill-down layers where people have committed real attention.
Color and layout matter more than the marketing metrics dashboard’d think. A single accent color for “needs attention” beats a rainbow of status indicators. If everything is highlighted, nothing is.
Test your marketing metrics dashboard on a phone before you call it done. If the north star and its trend aren’t instantly readable on a small screen, redesign the top layer. Your future self, checking numbers in a parking lot, will thank you.
Marketing Metrics Dashboard Tips for Choosing Metrics That Actually Matter
Now we reach the heart of it. These tips are about the numbers themselves — which ones earn a place, which ones lie to you, and how to keep the whole set honest. This is where most of the real judgment lives.
8. Kill Vanity Metrics Without Mercy
Vanity metrics feel good and inform nothing. Follower counts, raw pageviews, total email subscribers, cumulative downloads — numbers that only go up and never tell you whether anything is working.
The test is simple. A thoughtful approach to marketing metrics dashboard reinforces your qualifications. Ask: “Could this number go up while the business gets worse?” If yes, it’s a vanity metric. Follower count can climb while engagement and revenue fall. Pageviews can spike on traffic that never converts.
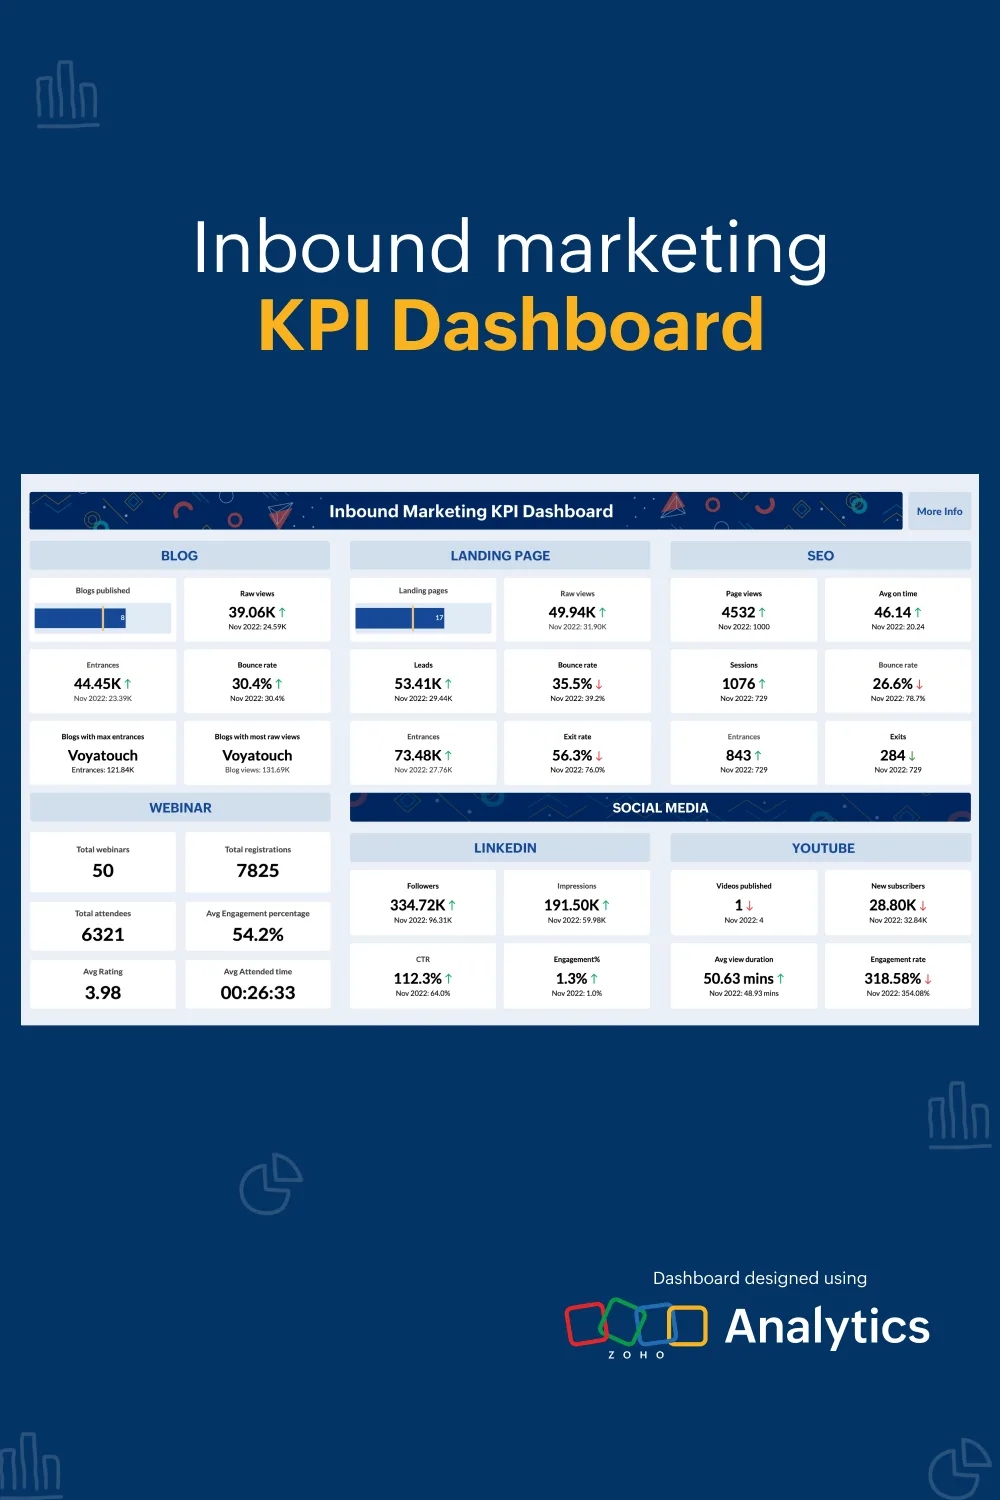
That doesn’t mean these numbers are useless — they can be diagnostic context. But they don’t belong on the top layer of a decision-focused marketing metrics dashboard. Demote them to drill-down or cut them entirely.
Be ruthless here. Every vanity metric you remove makes room for a metric that actually guides action. The discipline of cutting is what separates a sharp dashboard from a crowded one.
9. Pair Every Metric With Its Counter-Metric
Any single metric can be gamed or misread in isolation. Pair it with a counter-metric and the picture gets honest fast.
Conversion rate pairs with traffic quality. If conversion climbs but traffic quality drops, you may be attracting low-intent clicks that inflate the ratio. Cost per lead pairs with lead quality — cheap leads that never close are expensive in disguise.
This pairing habit is one of the most underrated marketing metrics dashboard best practices. It forces you to look at trade-offs instead of single numbers in a vacuum.
When you build the dashboard, place counter-metrics right next to their partners. Side-by-side comparison makes the trade-off visible at a glance, which is exactly when you want people thinking about it.
10. Tie Every Metric to a Dollar Value Where You Can
Marketing speaks in percentages; finance speaks in currency. Bridging that gap is how a marketing metrics dashboard earns a seat at the budget table.
The marketing metrics dashboard don’t need perfect attribution to do this. Even directional estimates — “this channel produces roughly X in pipeline per month” — change the conversation from “we got more clicks” to “we generated this much value.”
Start with the channels where attribution is cleanest and work outward. Label estimates as estimates. The goal isn’t false precision; it’s translating marketing activity into the language decision-makers already use.
Once your dashboard shows dollar impact alongside engagement metrics, something shifts. Structuring your marketing metrics dashboard around proven patterns ensures impact. Marketing stops being a cost center in the room and starts being a revenue engine with a scoreboard.
11. Review the Metric Set Quarterly — and Retire What’s Stale
Businesses change. A metric that mattered two quarters ago may be irrelevant now. A dashboard that never evolves becomes a museum of old priorities.
Put a quarterly review on the calendar. For each metric, ask: “Is this still driving a decision?” If it hasn’t informed a single choice in three months, retire it or move it to drill-down.
This keeps the marketing metrics dashboard lean and current. It also signals to the team that the dashboard is a living tool, not a monument — which encourages people to suggest improvements instead of accepting clutter.
Retiring metrics is emotionally hard. Someone built that chart. But a dashboard’s job is to serve current decisions, not preserve past effort. Keep it honest and keep it moving.
Putting It All Together: Your Marketing Metrics Dashboard Checklist
Eleven tips is a lot to hold in your head. So here’s the whole thing compressed into a working marketing metrics dashboard checklist you can run against your current setup or use as a build spec for a new one.
| Checklist Item | What “Done” Looks Like | Tip Reference |
|---|---|---|
| Decision-first metrics | Every top-layer metric names the decision it informs | Tip 1 |
| Leading + lagging pairing | Each lagging result has a leading predictor beside it | Tip 2 |
| Single north star | One hero metric, defended and stable | Tip 3 |
| Metric dictionary | Plain-language definitions, formulas, sources, owners | Tip 4 |
| Layered structure | Overview, channel, drill-down — three clear levels | Tip 5 |
| Automated + audited data | Automated pulls with a monthly reconciliation check | Tip 6 |
| Mobile-first top layer | North star and trend readable on a phone instantly | Tip 7 |
| Vanity metrics cut | Feel-good numbers demoted or removed from the top | Tip 8 |
| Counter-metric pairing | Each key metric sits beside its trade-off partner | Tip 9 |
| Dollar translation | Metrics show estimated value where attribution allows | Tip 10 |
| Quarterly review | Stale metrics retired, set kept current | Tip 11 |
Run this checklist against your existing dashboard and you’ll likely find three or four items where you’re weak. That’s normal. Pick the weakest one and fix it this week. Then the next.
A great marketing metrics dashboard isn’t built in a day. It’s built through a series of small, disciplined decisions — and this checklist keeps those decisions visible.
Common Mistakes That Undermine a Marketing Metrics Dashboard
Even well-built dashboards stumble on a handful of predictable mistakes. Knowing them in advance saves you a painful rebuild.
The biggest is building for the demo instead of the daily use. A dashboard that looks stunning in a presentation but is awkward to open on a Tuesday morning will lose. Optimize for the boring, repeated use case.
Second is over-customization. Every stakeholder wants their own view, and soon you’re maintaining twelve variations of the same dashboard. Standardize the layers, personalize only the drill-downs.
Third is treating the dashboard as finished. A dashboard is a product, not a project. It needs a cadence of review, iteration, and occasional retirement. The teams that treat it as living infrastructure get real value; the ones that ship and forget get a slow fade into irrelevance.
Avoid these three and you’re already ahead of most marketing teams. The marketing metrics dashboard itself is never the finish line — it’s the habit of using it that matters.
Frequently Asked Questions About Marketing Metrics Dashboards
These are the questions I hear most often when teams start building or rebuilding their measurement setup. Short answers here, with the tips above providing the depth.
What Should a Marketing Metrics Dashboard Track First?
Start with your north star metric and two leading indicators that predict it. Add channel-level performance once the top layer is stable. Resist the urge to track everything on day one — a focused dashboard beats a comprehensive one that nobody reads.
How Many Metrics Should a Dashboard Show?
Five to seven on the top layer, no more. The middle layer can hold fifteen to twenty. Anything beyond that belongs in drill-down or a separate analysis. The number of metrics isn’t a virtue; the number of decisions supported is.
How Often Should a Marketing Metrics Dashboard be Updated?
Match the refresh rate to the decision cycle. Daily for fast-moving channels like paid media, weekly for content and email, monthly for strategic reviews. Real-time updates are rarely worth the complexity unless you’re actively managing live campaigns.
What’s the Difference Between a Marketing Dashboard and a Marketing Metrics Dashboard?
They’re often used interchangeably, but a marketing metrics dashboard is specifically built around a curated set of metrics tied to decisions. A general marketing dashboard might show activity; a metrics dashboard shows what matters and why. The distinction is discipline, not software.
Do I Need Expensive Tools to Build One?
No. The judgment behind the dashboard matters far more than the tool. Plenty of teams run effective dashboards on modest, competitive direct manufacturer pricing from analytics and BI platforms. Start simple, prove the value, then invest in tooling as your needs grow.
Who Should Own the Marketing Metrics Dashboard?
One named owner, usually someone in marketing operations or analytics. Shared ownership sounds collaborative but produces neglect. The owner maintains the dictionary, runs the audits, and leads the quarterly review. Everyone else consumes and gives feedback.
Where to Go from Here
You now have eleven tips, a checklist, a mistake list, and answers to the common questions. That’s a full marketing metrics dashboard guide in one sitting. The question is what you do with it.
My advice: don’t try to implement everything at once. Pick the single tip that would most change how your team uses its dashboard, and apply it this week. Then the next. Small, compounding improvements beat a grand rebuild every time.
If you’re building from scratch, start with tips one through four. They set the foundation everything else rests on. If you already have a dashboard, run the checklist and find your weakest link. Either path works — as long as you actually walk it.
The teams that win with measurement aren’t the ones with the fanciest tools. They’re the ones who treat their marketing metrics dashboard as a decision-making instrument and refine it relentlessly. That’s the whole game. Everything else is just charts.
For verified reference and background research, consult the authoritative informational resource on this topic.