Interaction to next paint is the metric that decides whether your interface feels instant or sluggish, and the good news is you can fix it with a repeatable process. If you have ever clicked a button, waited, and wondered whether the page even registered your tap, you already understand the problem INP measures.
This is the hands-on interaction to next paint guide I wish existed when I first started chasing slow clicks in the field.
No theory dumps, no vague advice about “optimizing responsiveness.” Just nine steps, in the order I actually run them, that take a laggy page and turn it into something that answers back in under two hundred milliseconds.
We will cover how the metric is measured, how to find the interactions that hurt you most, how to break up long tasks, and how to build a lightweight interaction to next paint checklist you can hand to any developer on your team. Stick with me and you will walk away with a working process, not just a definition.
What Interaction to Next Paint Actually Measures
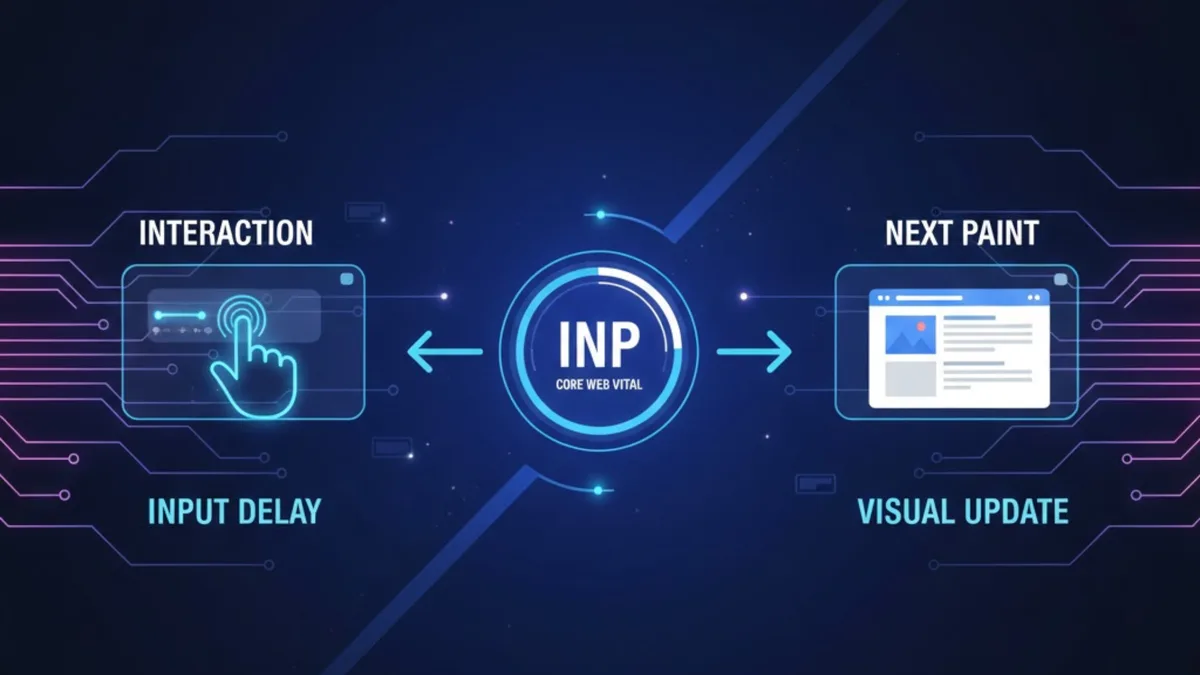
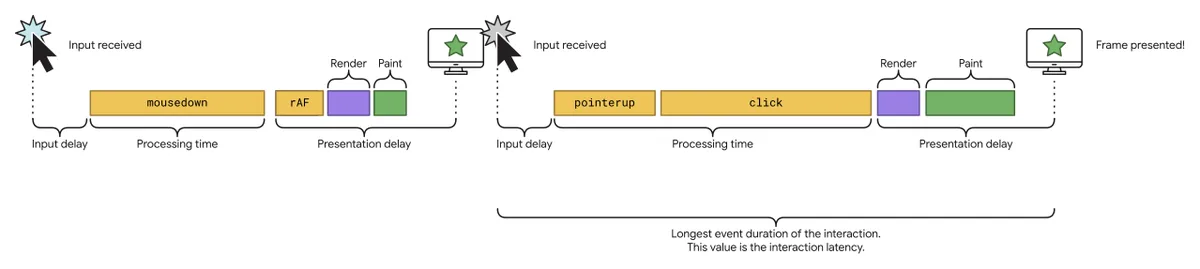
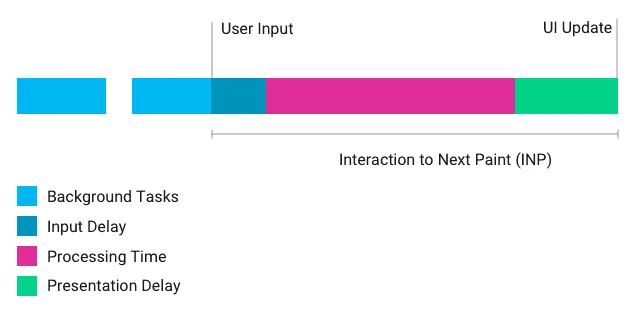
At its core, interaction to next paint tracks the delay between a user action and the next frame the browser draws in response. That action could be a tap, a click, or a key press. The browser records how long it takes from the moment of input to the moment the screen visibly updates.
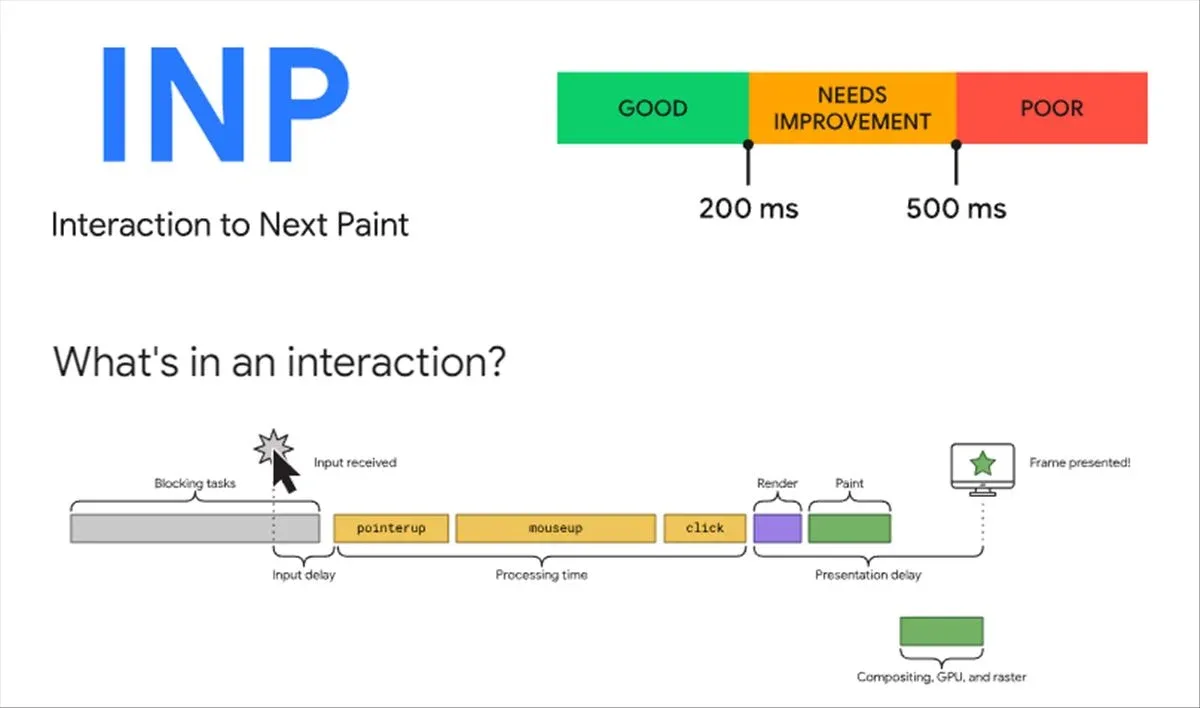
Here is the part people miss. It is not measuring your JavaScript execution alone. It is measuring the entire chain: input delay while the main thread is busy, event handler processing, and the render work needed to show the result. A slow handler and a heavy layout both count against you.
The final score is close to the worst interaction your visitors experienced, with a little smoothing so that a single outlier does not destroy the whole report. That design choice is deliberate. It means one broken button can drag your score down even if ninety-nine percent of your page is snappy.
For the formal specification, the web.dev documentation on interaction to next paint is the canonical reference and worth bookmarking. The metric replaced First Input Delay as a Core Web Vital because FID only looked at the first input and ignored everything after it.
Why This Metric Deserves Your Attention
Real users do not experience your page as a collection of metrics. They experience it as a series of small moments where they asked for something and waited for an answer. Interaction to next paint is the closest thing we have to measuring those moments at scale.
Consider the practical stakes. When a tap feels ignored, people tap again. That second tap often triggers a duplicate request, a double submission, or a frustrated back button. None of that shows up in a lab test, but it absolutely shows up in your conversion numbers.
Search engines have also made responsiveness part of how they evaluate page experience. That does not mean you should chase a score for its own sake, but it does mean slow interactions now carry a double cost: lost users and weakened visibility. In my experience the user-facing benefit always arrives first and the ranking benefit follows.
How to Read Your Interaction to Next Paint Data
Before you change a single line of code, you need real field data. Lab tools like Lighthouse give you a snapshot, but interaction to next paint is a field metric at heart because it depends on real devices, real networks, and real user behavior.
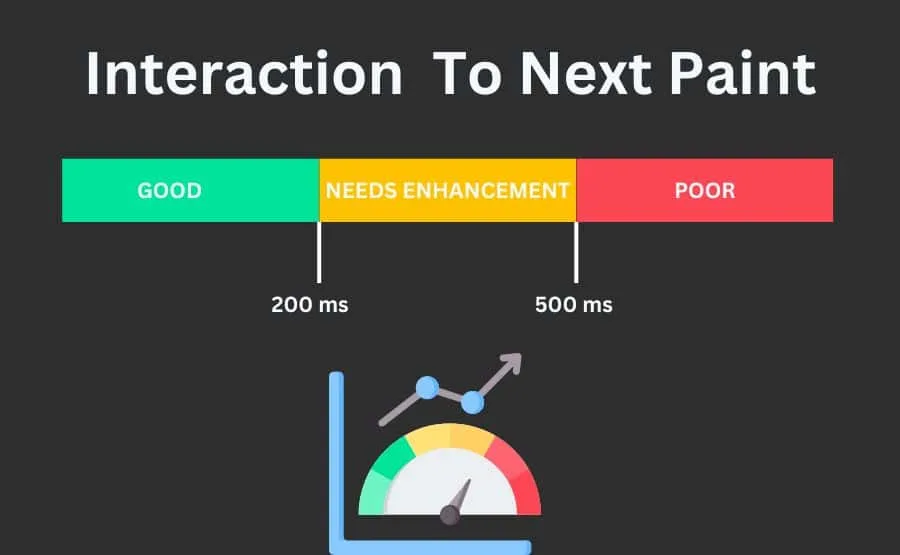
The Chrome User Experience Report gives the interaction to next paint a distribution of real interactions across your visitors. Look at the 75th percentile, because that is the number that determines whether you pass. If your p75 sits above 200 milliseconds, you have work to do.
Pair that with the Performance panel in Chrome DevTools for local reproduction. The panel shows you long tasks, event handlers, and render work on a timeline, which is exactly the detail you need once you know which pages are struggling.
| Data Source | What It Tells You | Best Use |
|---|---|---|
| Chrome User Experience Report | Real p75 interaction latency across visitors | Confirm whether a page passes or fails |
| Performance Panel | Timeline of tasks, handlers, and rendering | Reproduce and diagnose slow interactions |
| Web Vitals Extension | Live metric while you interact with a page | Quick sanity checks during development |
| Real User Monitoring | Attribution down to specific elements | Prioritize fixes by impact |
If you only have time for one source, pick real user monitoring with element attribution. Knowing that your checkout button is slow is worth more than knowing the page overall is slow, because it points you straight at the fix.
The 9 Easy Steps for Better Results
Here is the core of this interaction to next paint guide. These nine steps are ordered by effort-to-impact ratio. Start at the top, work down, and re-measure after every two or three changes so you can tell which one actually moved the needle.
Do not try to do all nine in a single sprint. In practice, the first three usually deliver the biggest gains, and the remaining six keep you from regressing once traffic grows and features pile up.
Step 1: Measure Real Interactions Before You Touch Code
Every optimization effort should begin with evidence. Capture a baseline of your p75 interaction to next paint across your most important templates: homepage, product or listing pages, checkout, and any page with heavy interactive widgets.
Write the numbers down somewhere your team will see them. A baseline turns arguments about performance into a shared scoreboard. It also protects you from the classic trap of “optimizing” something that was never slow while the actual bottleneck sits untouched.
I usually record three figures per template: the p75 value, the worst offending element, and the device class where the interaction to next paint hurts most. Mobile mid-tier Android devices almost always reveal problems that a fast desktop machine hides.
Step 2: Find the Slowest Element, Not the Slowest Page
Page-level scores are a starting point, but interaction to next paint is fundamentally about elements. Attribution data tells you which specific buttons, links, form fields, or menu toggles are producing the worst latency.
When you have that list, sort it by traffic volume multiplied by latency. A mildly slow button that everyone taps matters more than a catastrophically slow toggle that three people per month touch. Prioritization is where most teams quietly go wrong.
One client had a search filter that took nearly a second to respond. Nobody had flagged it because the page score looked acceptable. Attribution data surfaced it immediately, and fixing that single control cut their overall p75 by more than a third.
Step 3: Break Up Long Tasks on the Main Thread
This is usually the single highest-leverage change you can make. A long task blocks the main thread, which means an incoming click has to wait its turn before your handler even starts running. That waiting period is pure input delay.
The fix is to chop large chunks of work into smaller pieces that yield back to the browser. Techniques like scheduling with setTimeout, requestIdleCallback, or the scheduler API let the browser paint and respond between chunks.
Take a product filter the interaction to next paint loops over thousands of items. Instead of processing everything in one synchronous block, process two hundred at a time and yield between batches. The total work is identical, but the interface stays responsive the whole way through.
According to Google’s own interaction to next paint best practices, yielding is often worth more than micro-optimizing the loop itself. A slow loop that yields beats a fast loop that blocks.
Step 4: Trim the JavaScript That Runs on Interaction
Event handlers should do the minimum necessary and defer the rest. A common pattern is a click handler that updates state, recalculates a layout, writes to storage, and fires an analytics call, all in one synchronous run.
Split that apart. Update the visible state first so the user sees an immediate response, then queue the analytics ping and storage write for later. The perceived speed changes dramatically even though the same work eventually happens.
Watch for accidental work in handlers: re-rendering an entire list when one row changed, recalculating styles in a loop, or reading layout properties that force the browser to synchronously recalculate geometry. Those layout reads inside a loop are a silent killer.
Step 5: Reduce Input Delay from Third-Party Scripts
Third-party tags are the most underrated cause of slow interactions. Chat widgets, tag managers, heatmap tools, and A/B testing libraries often run their own tasks on the main thread, and they do not care about your interaction to next paint.
Audit what loads on your critical templates. Defer anything non-essential, self-host what you reasonably can, and consider moving heavy scripts into a web worker where the tool supports it.
For a practical interaction to next paint tips list, add this one near the top: load third-party scripts after the first interaction, not before. Many widgets can be lazy-initialized on hover or focus without any visible loss of functionality.
Step 6: Give Visual Feedback Before the Work Finishes
Sometimes the work genuinely takes time and the interaction to next paint cannot make it instant. In those cases, perceived performance is your friend. Show a pressed state, a spinner, or an optimistic update within one frame of the interaction.
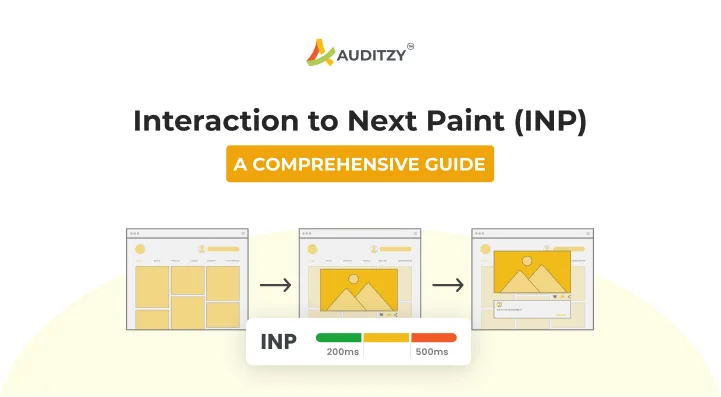
This does not change the measured interaction to next paint directly if the paint is a cheap placeholder, but it does prevent users from tapping again out of uncertainty. Fewer duplicate taps means fewer wasted tasks competing for the main thread.
Optimistic UI is especially powerful in forms and toggles. Flip the switch immediately, then reconcile with the server response. If the request fails, roll back and tell the user clearly.
Step 7: Speed Up Rendering After the Handler Runs
The metric does not stop when your handler returns. It stops when the next frame paints. If your handler triggers a massive layout or a heavy paint, you still pay the cost.
Keep DOM changes local. Instead of re-rendering a whole container, update only the affected nodes. Avoid animating properties that trigger layout, and prefer transforms and opacity which the compositor can handle cheaply.
Also watch for style thrash inside event handlers. Reading a layout property and then writing a style in a loop forces the browser to recalculate repeatedly. Batch all reads first, then all writes.
Step 8: Test on Real Mid-Tier Devices
Your laptop is not your user. A thoughtful approach to interaction to next paint reinforces your qualifications. A modern desktop machine has enormous headroom, so it will happily hide problems that cripple a three-year-old phone. Test on a real mid-tier Android device with a throttled network.
Chrome DevTools lets you simulate slower CPUs and networks, which is convenient for quick checks. But nothing replaces holding the actual device. Touch latency, thermal throttling, and background apps all shape the real experience.
Build a device lab on the cheap. One older Android phone and one older iPhone will catch the vast majority of interaction to next paint problems that emulation misses.
Step 9: Monitor, Alert, and Guard Against Regressions
Performance is not a one-time project. Every new feature, script, or framework upgrade can silently erode the gains you just made. Set up monitoring with alerts on the p75 value per template.
Add performance budgets to your build pipeline so a heavy dependency cannot slip in unnoticed. Review field data monthly and treat regressions with the same urgency as a bug report.

Keep a lightweight interaction to next paint checklist attached to your pull request template. It is a small habit that keeps the whole team honest over time.
Your Interaction to Next Paint Checklist
Here is a compact checklist you can paste into a ticket, a pull request template, or a performance review doc. It covers the checks that catch the most common regressions before they reach production.
- Baseline recorded. Capture the p75 value per key template and store it where the team can see it.
- Worst elements identified. Use element attribution to find the slowest interactive controls.
- Long tasks removed. No task on the main thread exceeds fifty milliseconds during common interactions.
- Handlers trimmed. Each handler does the minimum, with non-visual work deferred.
- Third-party scripts audited. Non-essential widgets load after or on demand.
- Visual feedback in place. Every action shows a pressed or pending state within one frame.
- Render work localized. No full-container re-renders for single-item changes.
- Device tested. Verified on a real mid-tier phone with throttled network.
- Monitoring active. Alerts fire when the p75 crosses the 200 millisecond threshold.
Print the interaction to next paint, share it, argue about it. The exact wording matters less than having a shared reference point when someone proposes adding a heavy script to the checkout page.
Common Mistakes That Sink Interaction to Next Paint Scores
The same failures show up again and again across audits. The first is optimizing average values instead of the p75 or worst case. Interaction to next paint is deliberately harsh about outliers, so averages flatter you into complacency.
The second is over-reliance on lab data. Lighthouse cannot simulate the three browser tabs, the background sync, and the low-battery throttling that your real users live with every day.
The third is treating performance as a launch checklist item instead of an ongoing discipline. A page that passed six months ago can fail today because a third-party tag grew heavier or a new framework bumped bundle size. Slow rot is real, and it is quiet.
The fourth, and perhaps most common, is fixing the wrong thing. Teams often spend weeks improving server response time when the actual bottleneck is client-side JavaScript execution after the click. Always let the data choose the target.
How Interaction to Next Paint Fits the Bigger Picture
Interaction to next paint is one piece of the broader Core Web Vitals program, and it should be understood as part of a family alongside Largest Contentful Paint and Cumulative Layout Shift. Handling one in isolation rarely delivers the full win.
Think of it this way: Largest Contentful Paint asks how fast the page shows up, Cumulative Layout Shift asks whether things move around, and interaction to next paint asks whether the page answers back. A page that scores well on two out of three will still feel broken to users.
That said, there is real overlap. Reducing JavaScript helps both loading and interaction. Serving less CSS reduces render work everywhere. Many improvements compound, which is why a holistic approach usually beats chasing one number at a time.
If you want to go deeper, explore the broader performance topics of main thread scheduling, JavaScript bundle budgeting, and progressive hydration. Those parent topics will echo back into this metric repeatedly as your app grows.
Quick Answers to Common Questions
Here is an in-depth breakdown of key considerations regarding this section:
What is Interaction to Next Paint?
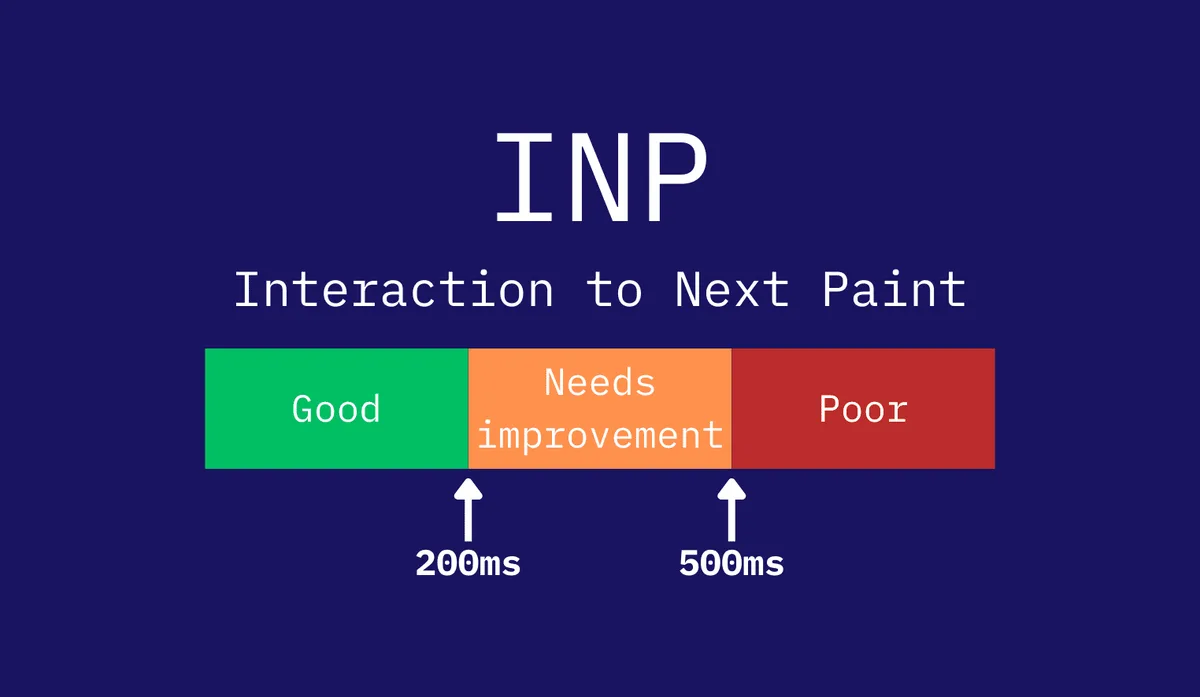
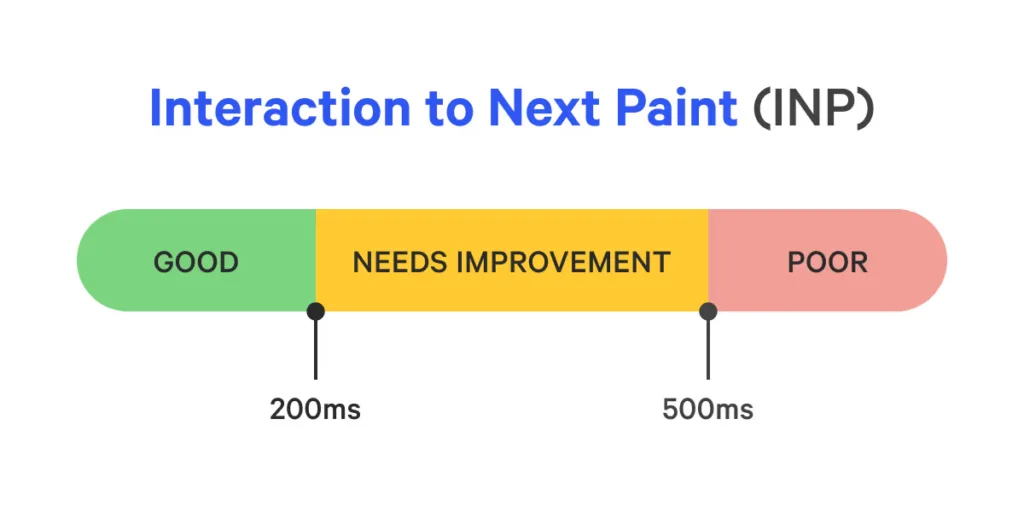
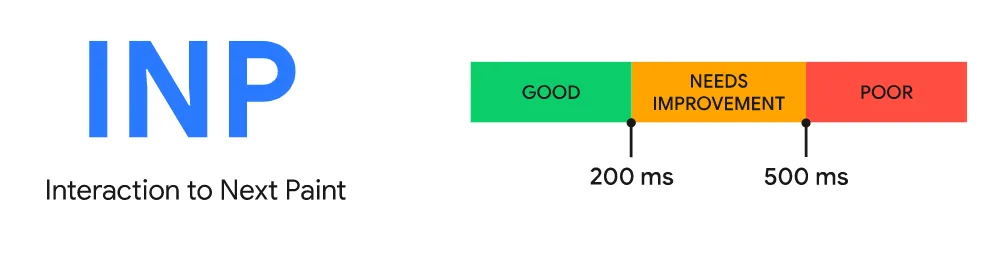
Interaction to next paint is a Core Web Vital that measures the latency between a user input and the next visual update the browser paints. Lower is better, and the goal is to keep the 75th percentile under two hundred milliseconds.
Is Interaction to Next Paint Different from First Input Delay?
Yes, in an important way. First Input Delay only measured the first interaction, and only the input delay portion of it. Interaction to next paint considers all interactions and follows each one all the way through to the painted frame, which is a much more honest picture.
What is a Good Interaction to Next Paint Score?
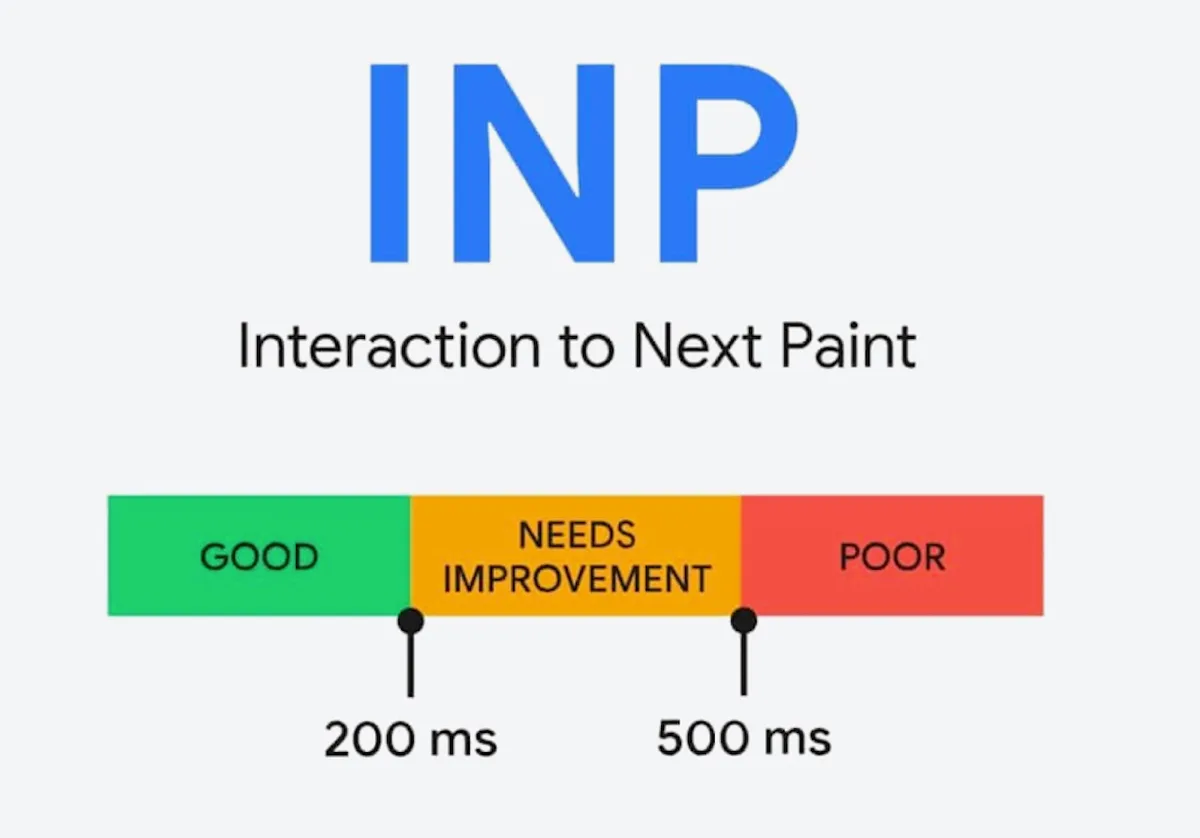
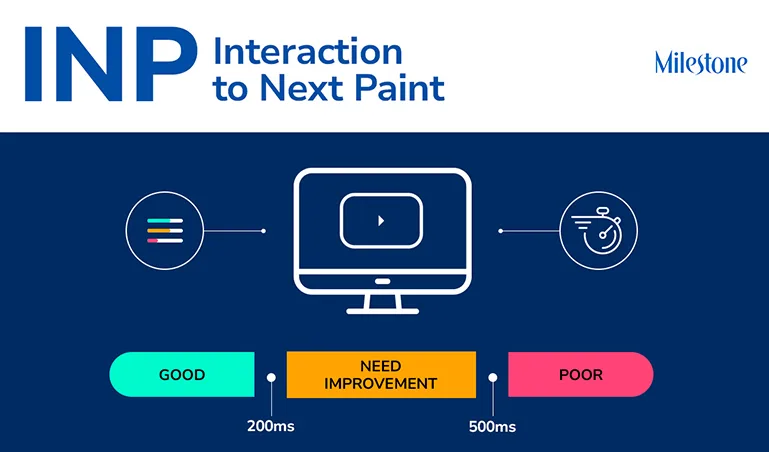
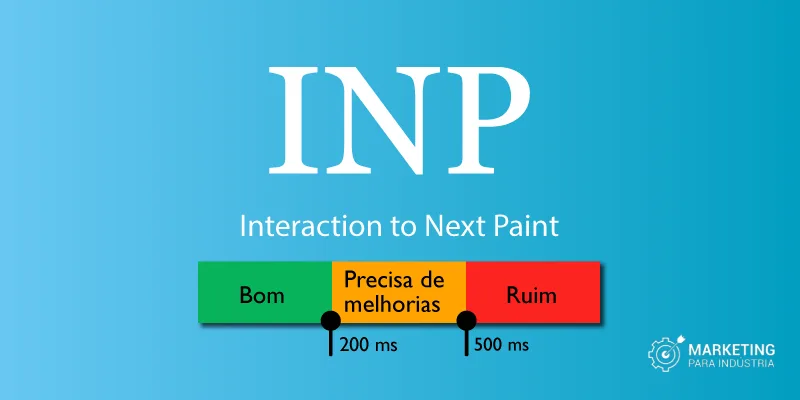
Under two hundred milliseconds is the target. Between two hundred and five hundred milliseconds is the needs-improvement band, and anything slower than that gets flagged as poor. Aim for under two hundred at the 75th percentile, not just on average.
Can I Improve It Without Rewriting My App?
Almost always. Yielding on long tasks, trimming JavaScript in handlers, deferring third-party scripts, and adding immediate visual feedback can move the needle substantially with no architecture changes at all. The nine steps above are ordered specifically for that scenario.
Where to Go from Here
Interaction to next paint rewards the kind of patient, evidence-driven work that separates a good web team from a great one. Measure first, fix the slowest element, break up the long tasks, then build a checklist and a monitoring habit so the gains stick.
None of the nine steps requires heroics. They require consistency, a real device on your desk, and the discipline to look at field data instead of trusting a lab snapshot. Do those three things and your interaction to next paint will improve, and your users will feel the difference long before any dashboard tells you.
If you take away one line from this interaction to next paint guide, let it be this: make the animation faster and separate the JavaScript that handles event handlers. Users do not care how clever your architecture is, only whether the interface answered when they tapped.