Infographic link building works because people link to things they can reuse, and a well-made visual asset gives publishers a reason to point at your brand instead of a competitor’s.
If you want a shortcut to the tactics that actually earn placements, this is the breakdown I wish someone had handed me when I started pitching designers and bloggers with nothing but a pretty picture and a polite email.
What follows is a straight-talking infographic link building guide built around nine approaches that hold up under scrutiny — the kind you can put on a calendar, hand to a freelancer, and measure by the end of the quarter.
Why Infographic Link Building Still Earns Placements
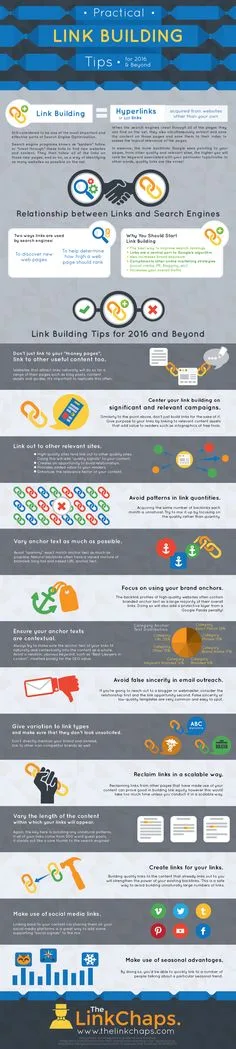
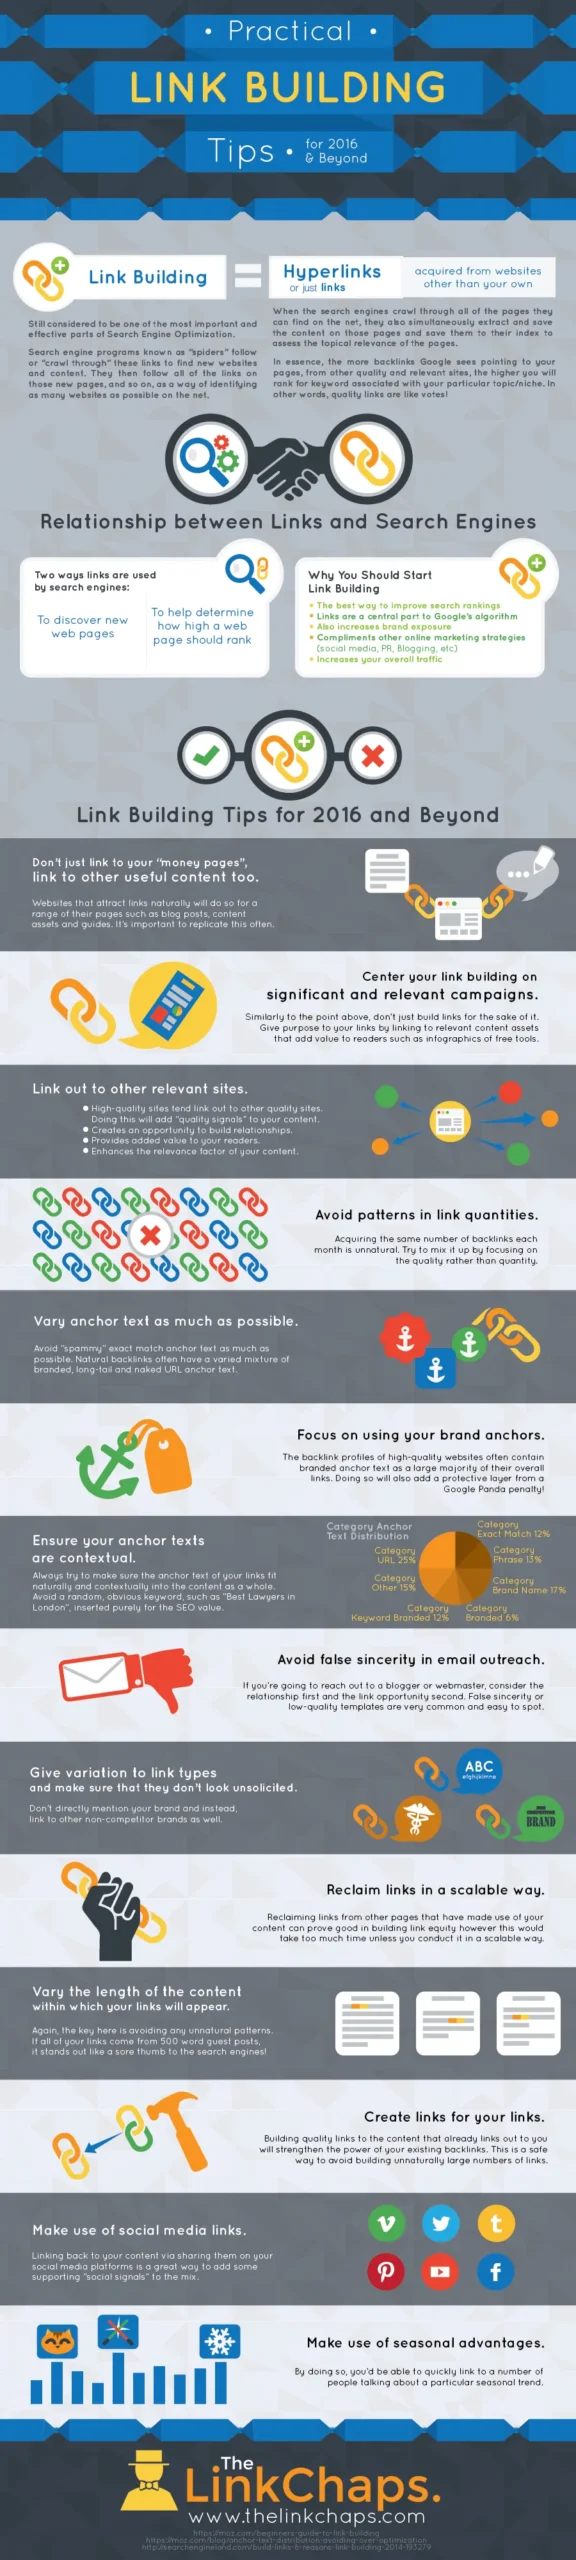
Search engines care about references. Focusing on infographic link building provides clear direction here. A link is a vote, and a visual asset is one of the few content formats that gives people a natural excuse to cast that vote.
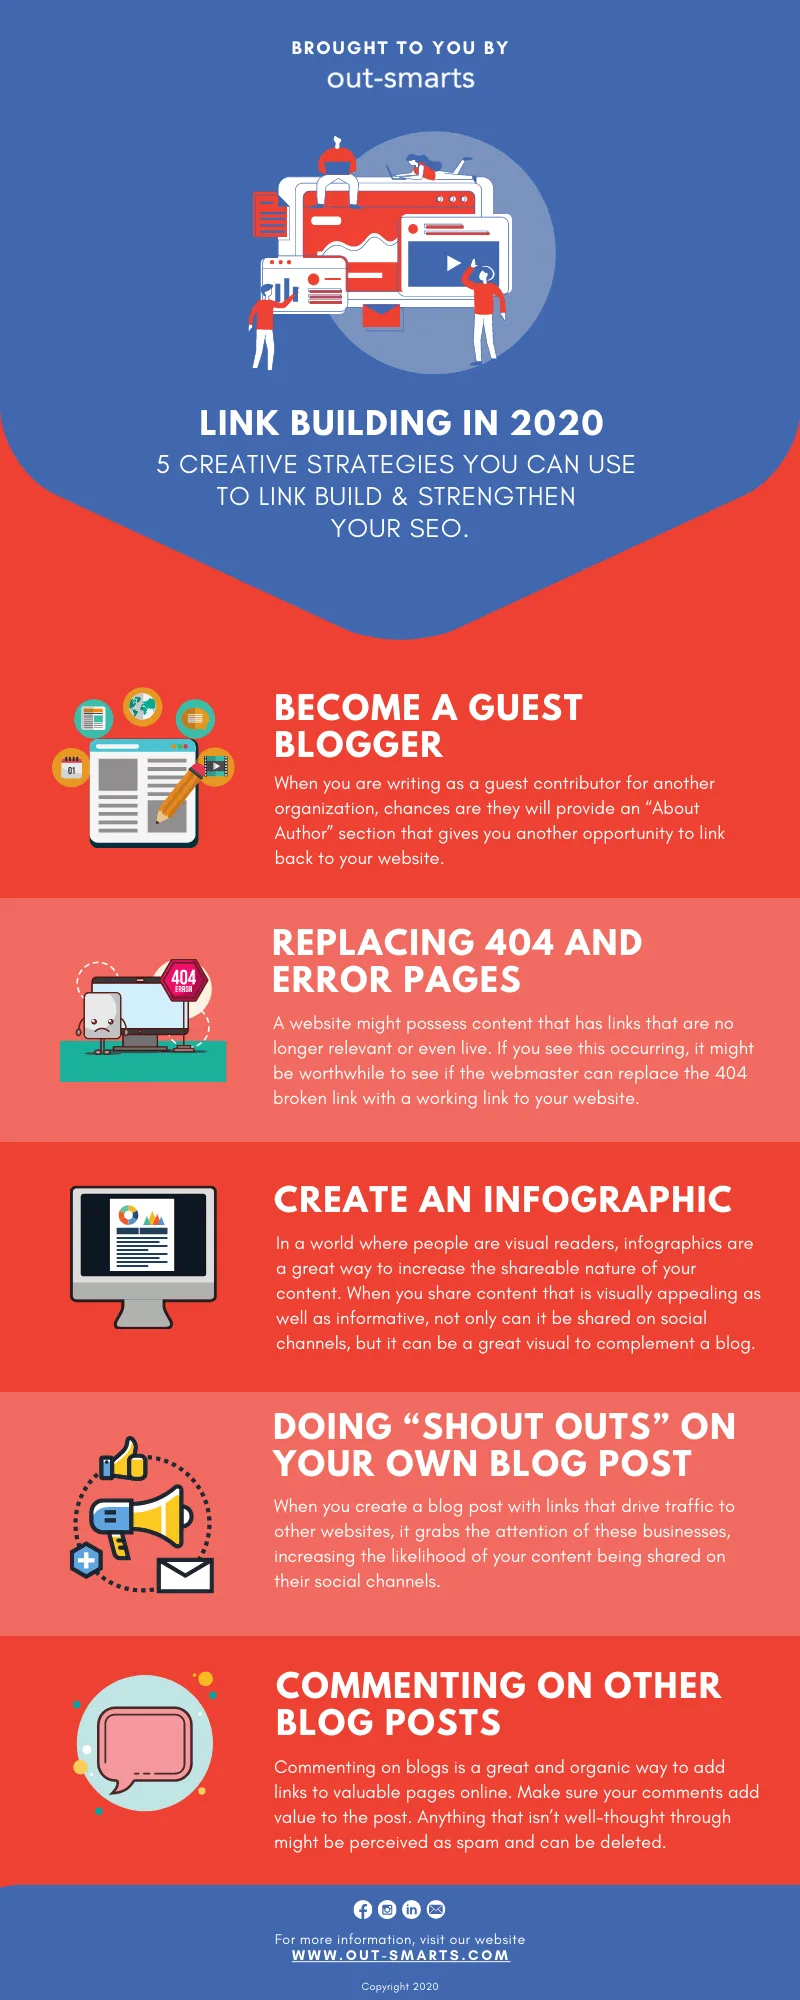
That’s the whole thesis behind infographic link building: you create something a blogger, journalist, or teacher can embed on their page and cite back to you.
The math is simple and unforgiving. One good infographic can land on dozens of pages across related niches — from classroom blogs and trade publications to resource roundups that stay online for years. Compare that to a guest post that earns one link on one domain and you’ll see why the format keeps resurfacing.
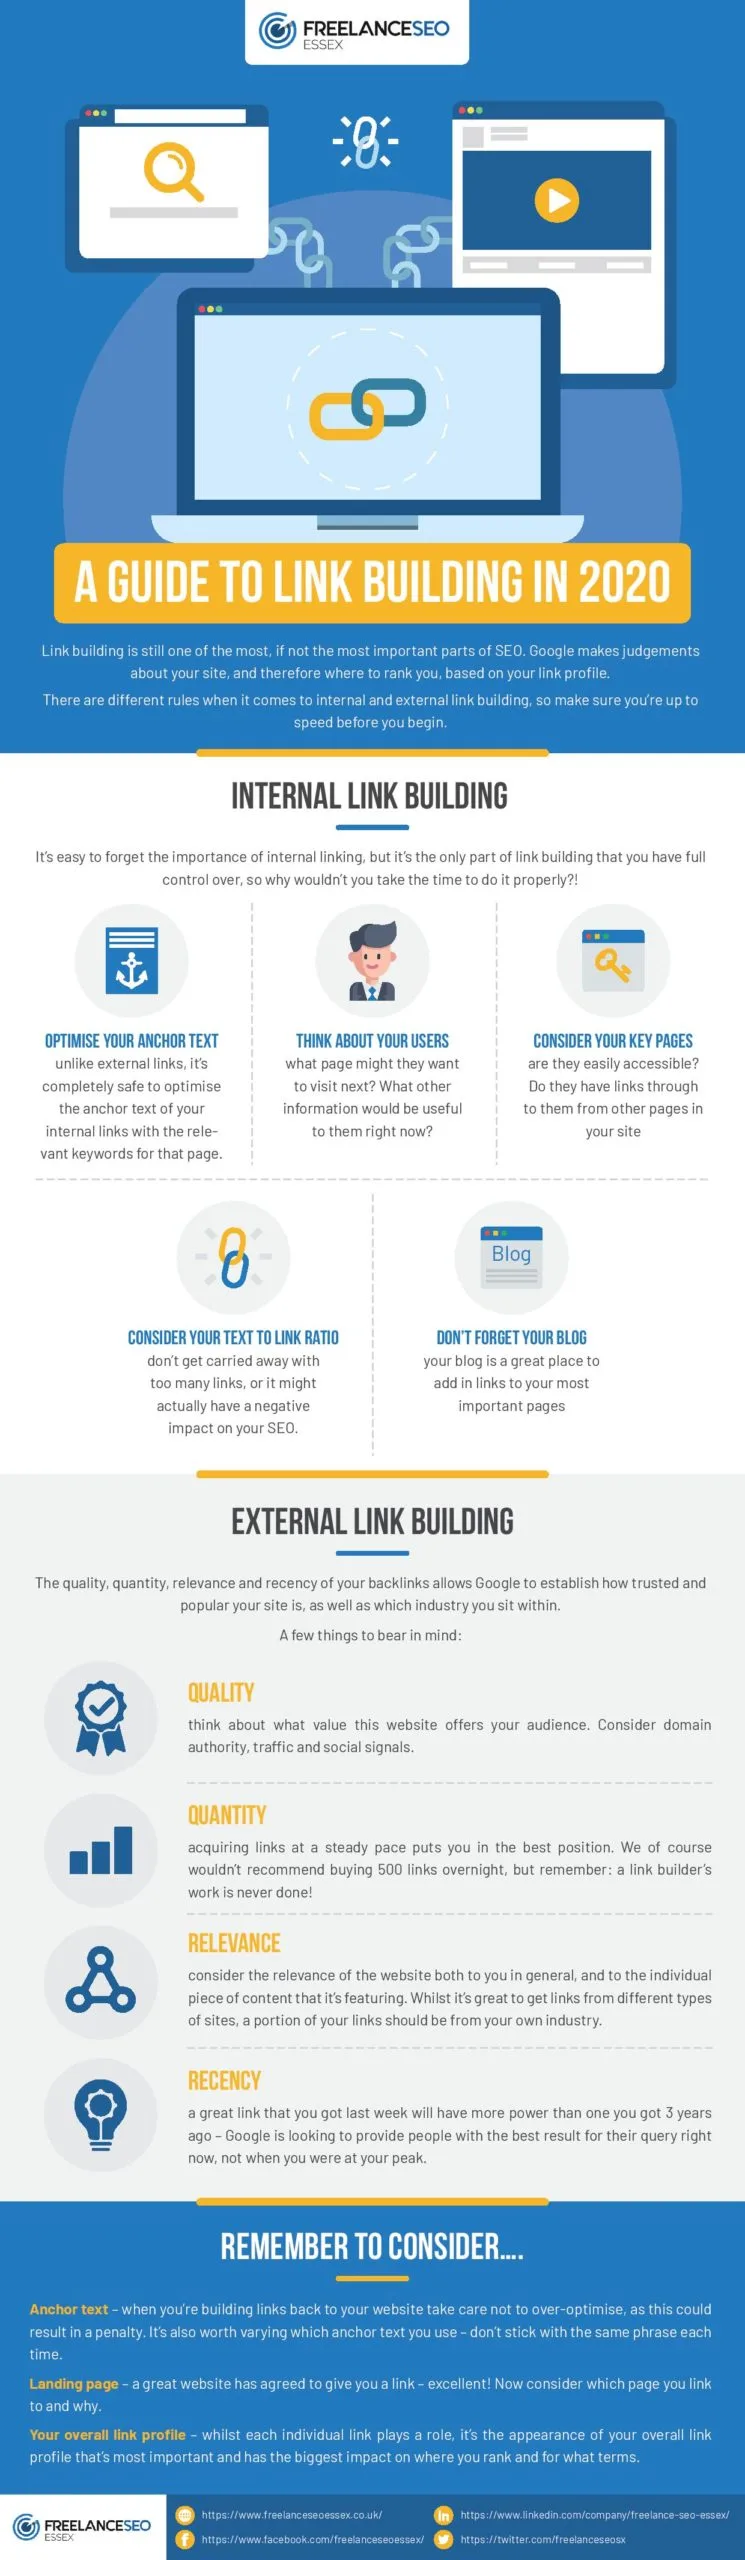
But here’s the part most guides skip: infographics stopped being novel somewhere around the time every content team discovered Canva. Refining each detail of your infographic link building strengthens this section. The format alone buys you nothing now. What earns coverage is a specific, data-backed visual that answers a question people are already searching for.
| Asset Type | Typical Link Velocity | Effort Level | Best Fit |
|---|---|---|---|
| Original data infographic | High | Heavy | B2B research brands, SaaS |
| Process explainer graphic | Moderate | Medium | Service businesses, agencies |
| Comparison chart | Moderate to high | Medium | Ecommerce, review sites |
| Curated stats roundup | Lower | Light | Beginner bloggers |
Notice the pattern: the assets with the strongest link velocity do work the reader can’t easily do themselves. That’s your north star for everything below.
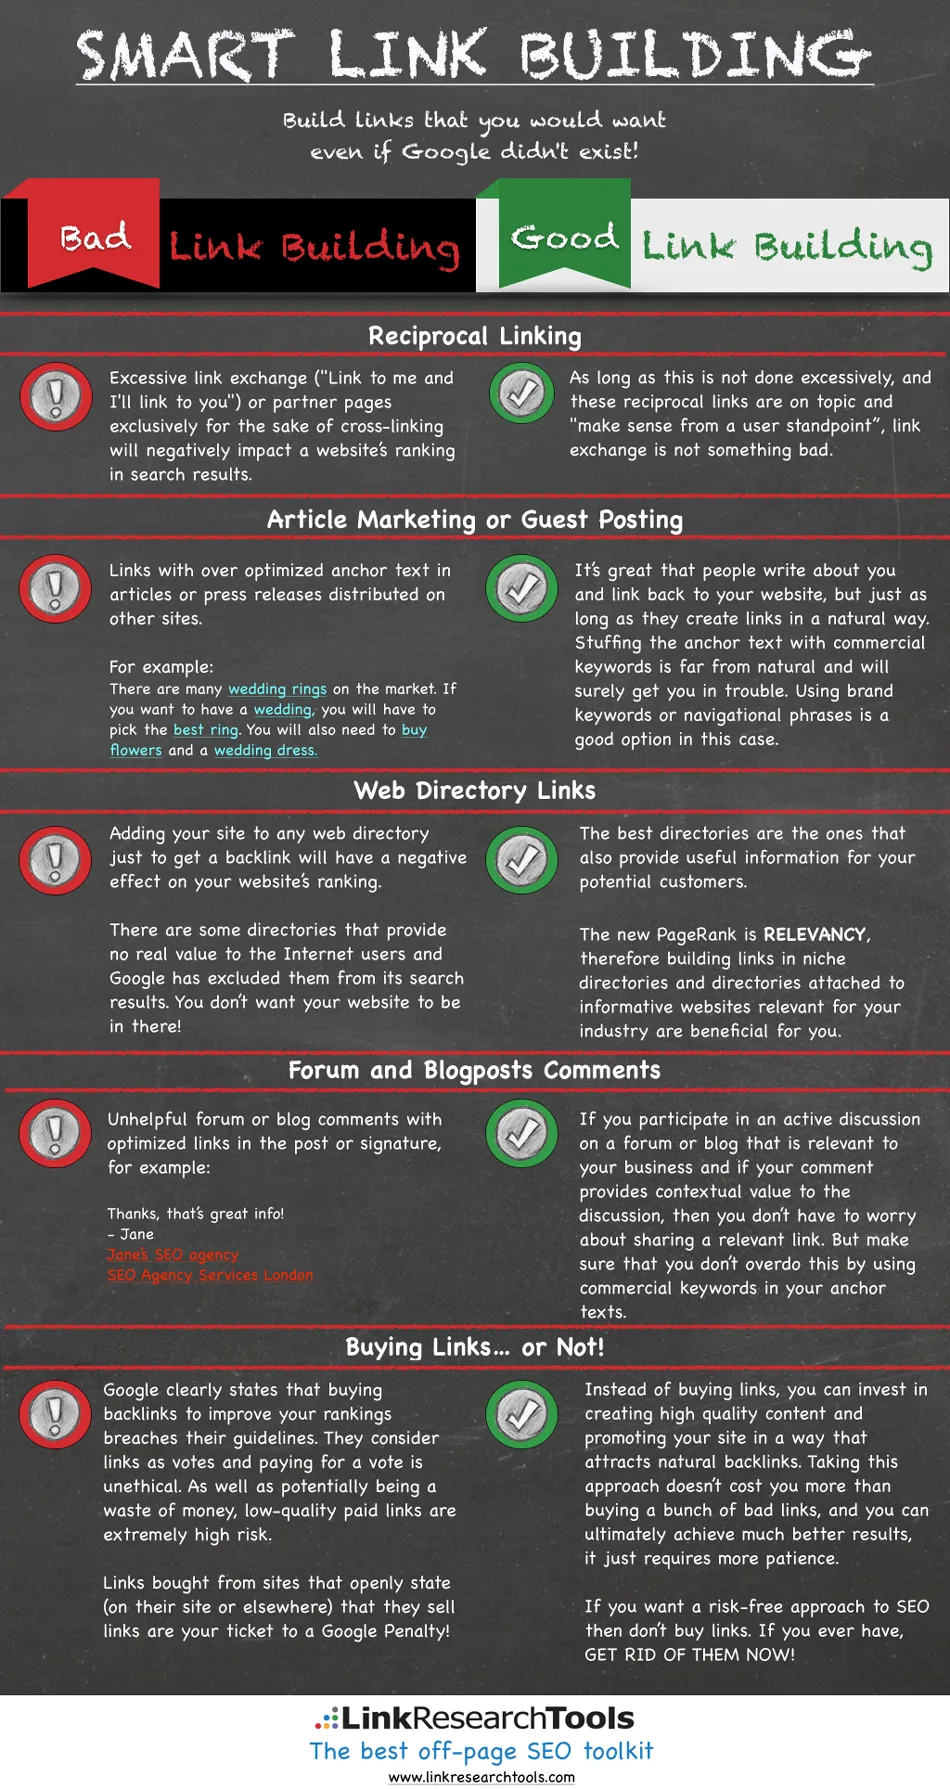
Building a Foundation: the Infographic Link Building Checklist
Before you pitch anyone, you need the plumbing in place. A proper infographic link building checklist keeps you from doing the fun creative work and then fumbling the technical details that determine whether your asset gets indexed, shared, and cited.
Run through the infographic link building items every single time. It takes twenty minutes and saves weeks of headache.
- Host the full graphic on your own domain first. Never let a third-party image host be the canonical source — you want the link equity landing on your site, and you want the image discoverable through your own sitemap.
- Write a dedicated landing page for each infographic. A full-size embed, a 300-word context write-up, and a plain-text summary of the data points. Journalists often pull the summary even when they embed the image.
- Provide an embed code snippet. Give publishers a simple iframe or image-plus-attribution block with the source link already baked in. Remove every friction point.
- Compress and serve modern formats. WebP with a PNG fallback, ideally under 300KB. Slow assets get skipped during editorial review.
- Add descriptive alt text that includes your core subject. This helps screen readers, image search, and anyone scanning a page for relevance.
- Create a press kit page. High-resolution download, a short blurb, talking points, and one sentence of attribution language publishers can copy verbatim.
- Set up tracking. Use a tool like Ahrefs or Semrush to monitor referring domains to the asset URL, and set a Google Alert for your brand name plus the graphic’s title.
If you only do three things from that list, make it hosting, the embed snippet, and the press kit. Those three carry the heaviest weight in any infographic link building program, and they’re the ones most often skipped.
The 9 Proven Tactics for Infographic Link Building
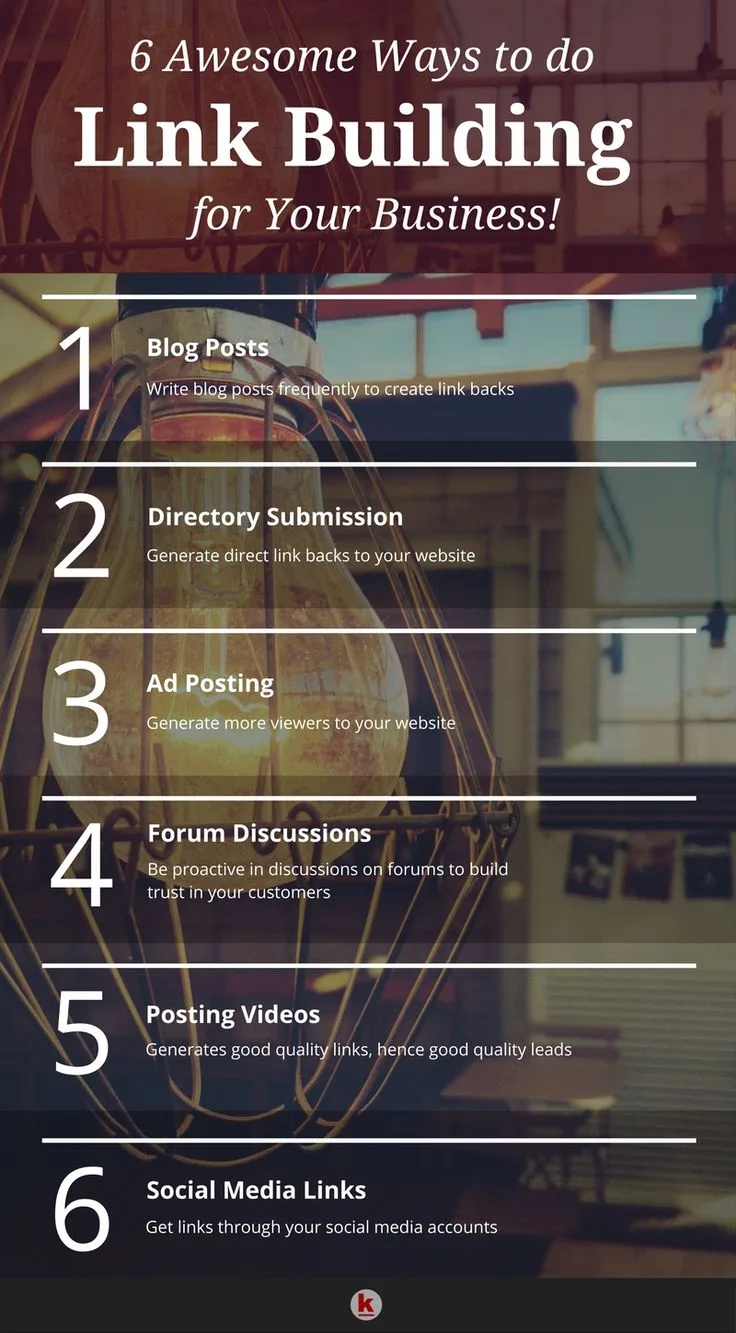
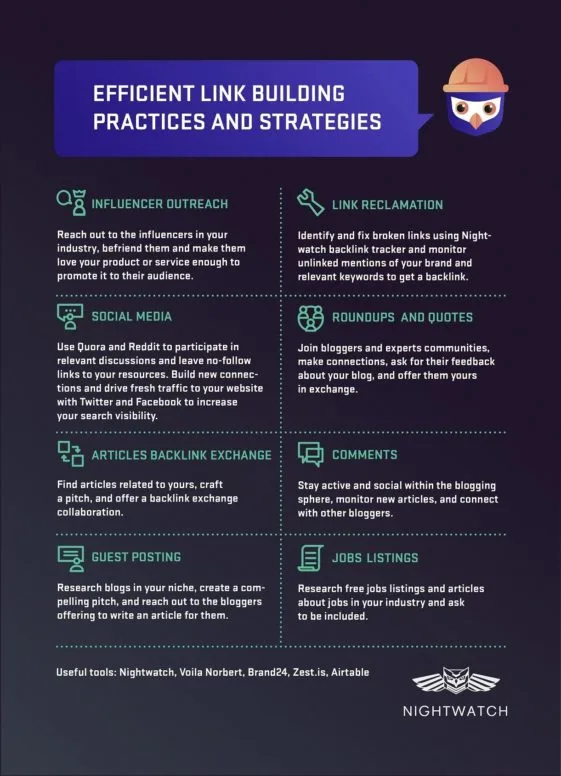
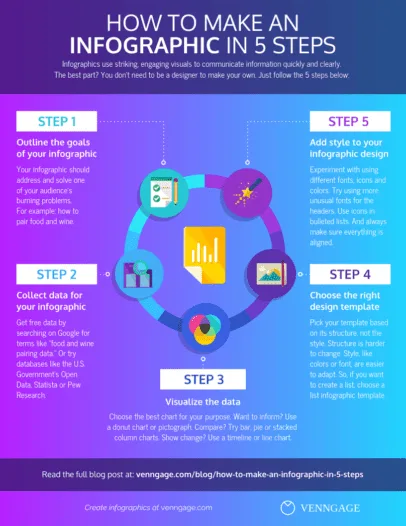
Nine tactics, grouped by the phase of the campaign they belong to. Some are about creation, some about distribution, some about the long tail of follow-up that most teams never get around to. Work through them in order the first time, then run them selectively once you know which channels fit your audience.
Each tactic below stands on its own, but the infographic link building compound. A data-driven graphic (tactic one) pitched through educator outreach (tactic five) and tracked with a broken-link sweep (tactic eight) produces a return no single tactic can match alone.
Tactic 1: Lead With Original Data Instead of Design Flair
Design gets the compliment. Data gets the citation. If you’re choosing where to spend your budget, put it into a small survey, an internal dataset, a public records scrape, or a manual audit of fifty competitor pages — anything that produces a number nobody has published before.
I’ve watched a hundred-dollar survey of 200 practitioners outperform a five-thousand-dollar illustration, because the resulting chart was the only place online where the infographic link building stat existed. Writers linked to it with phrases like “according to a survey of 200 respondents” — that’s the exact citation you want.
Concretely: pick one question your industry argues about, collect at least 100 responses, and present the finding as a single headline number with a supporting breakdown. Then let the rest of the graphic build around that anchor.
Tactic 2: Reverse-Engineer the Content That Already Earns Links
Don’t guess what publishers want. Structuring your infographic link building around proven patterns ensures impact. Look at what they’ve already published and linked to. Pull the top fifty linked pages in your niche from an SEO tool, then filter for visual-heavy posts — charts, comparisons, asset roundups.
For each one, note the asset type, the angle, and the specific claim the infographic link building earned the mention. You’ll usually spot three or four recurring formats within an hour. That’s your real brief.
This is where infographic link building stops being creative guesswork and starts behaving like a research process. Build the asset your niche has already proven it links to — with better data and cleaner design.
Tactic 3: Design for the Five-Second Read
A reader should grasp your core point before their coffee cools. Applying these principles to your infographic link building yields measurable results. Dense, multi-section infographics look impressive in a portfolio and get skipped in a feed. Keep the primary finding in the top third, use one dominant chart, and let everything else support it.
Practical rules I follow: no more than seven data points per graphic, a headline that states the conclusion instead of the topic, and source citations in a footer that’s legible at 50% zoom. On mobile — where most initial sharing happens — legibility collapses first.
If a graphic needs a spoken walkthrough to make sense, the infographic link building isn’t finished. Simplify until a stranger gets it in one glance.
Tactic 4: Pitch the Summary, Not the Picture
Cold-pitching “check out our new infographic” gets ignored. Pitching “we surveyed 200 marketing managers and 68% said their link-building budget goes to placements nobody measures” gets a reply.
The email should lead with the finding, offer a one-paragraph summary the writer can use verbatim, and mention the graphic as the visual companion. Developing your infographic link building with precision highlights key strengths. Journalists and bloggers are drowning in pitches — the one that hands them a usable stat wins by default.
Keep the message under 120 words, skip the attachments, and link to the press kit page. Follow up exactly once, seven business days later.
Tactic 5: Run Targeted Outreach to Educators and Resource Curators
Classroom sites, university library guides, and curated resource pages are the quiet workhorses of infographic link building. They link generously, they rarely remove links, and they value clarity over brand prestige.
Search for phrases like “useful resources for teaching [your topic]” or “[topic] explainer for students” and collect pages with an outdated or thin asset. Clear alignment with your infographic link building builds confidence from the start. Then pitch a replacement or an addition with a short, respectful note.
These links won’t move a competitive commercial keyword on their own, but they build a stable citation base and often trigger secondary coverage on education-adjacent blogs.
Tactic 6: Repurpose One Asset Into Twelve Distribution Points
The infographic is the source, not the whole campaign. Integrating infographic link building into your workflow produces consistent quality. Break it into a LinkedIn carousel, three tweet-sized stats, a short explainer video, a slide in an existing deck, a section of a newsletter, and a guest post pitch with the chart embedded.
Each repurposed piece can earn its own link on a different platform. A single survey graphic I tracked two years ago produced 41 referring domains, and roughly half came from the repurposed formats rather than the original post.
Schedule the repurposing before the infographic link building publish. If it isn’t on the calendar, it won’t happen.
Tactic 7: Build a Comparison Asset That Competitors Won’t Copy
Comparison graphics travel well because they answer buying questions directly. Put two to five options side by side on cost structure, feature coverage, or typical use case — and commit to a clear recommendation.
Wishy-washy comparisons get ignored. Readers share charts that take a position, even if they disagree with it. Just make sure the criteria are visible and the sourcing is honest, or the asset will burn trust instead of building it.
This tactic pairs especially well with commercial-intent keywords, where the readers are close to a decision and publishers are actively hunting for visual support.
Tactic 8: Hunt Broken and Outdated Visual References
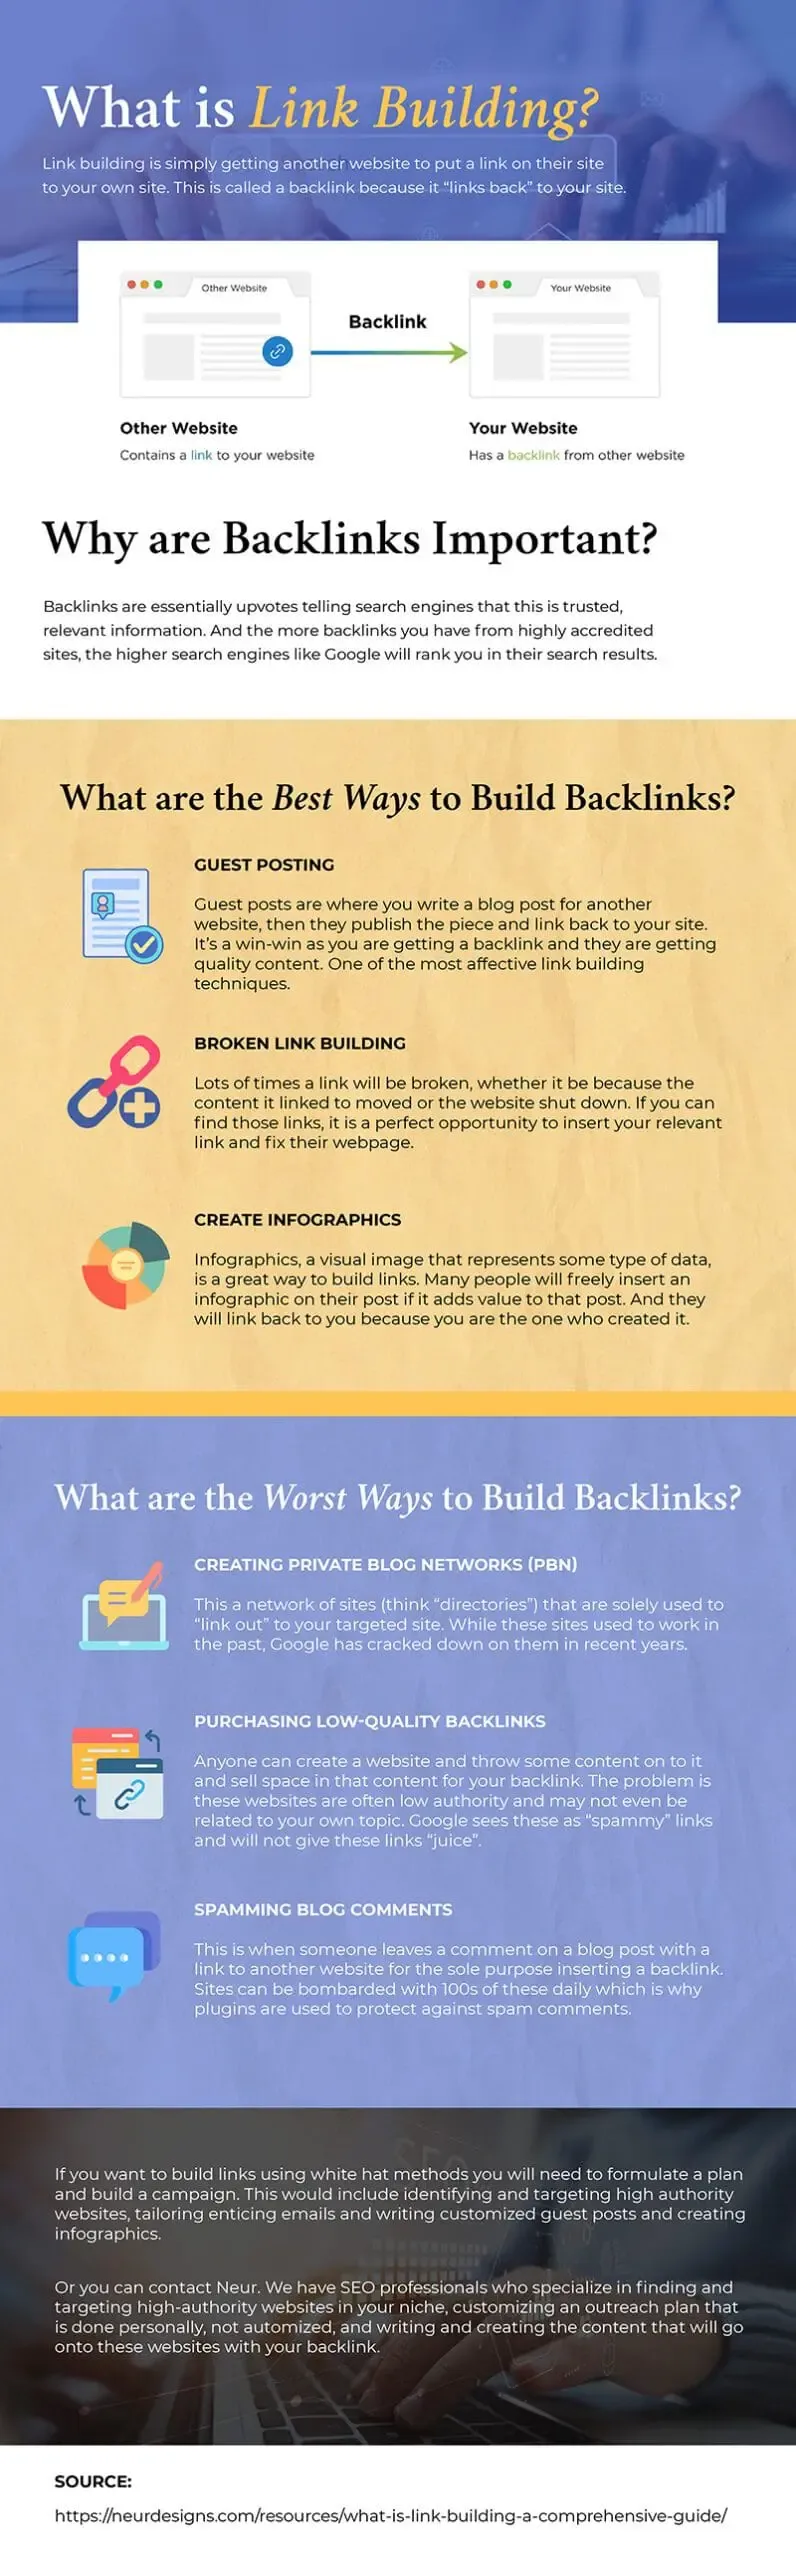
Find pages the infographic link building link to dead or outdated infographics in your space. Tools like Ahrefs’ broken backlink report or a quick Check My Links pass will surface them fast.
Reach out with a factual, non-salesy note: “The chart you linked in this section is no longer loading — we rebuilt the same data as a current comparison, happy to share if useful.” That framing works because it leads with a fix, not a favor.
The conversion rate here is genuinely higher than cold outreach, and the resulting links often sit in the most visible part of a resource page.
Tactic 9: Measure, Prune, and Repeat the Winners
Attribution is where most campaigns quietly die. Track referring domains per asset, note which outreach templates produced replies, and log the pitch-to-placement ratio for each channel.
After a full cycle, cut the channels the infographic link building returned nothing and double the budget on the two that worked. That feedback loop — not the design software — is what compounds over time.
I keep a simple spreadsheet with four columns: asset, channel, referrals earned, and time invested. It’s unglamorous and it has saved me from repeating three failed campaigns.
Infographic Link Building Best Practices for Outreach That Gets Replies
Outreach is a numbers game with a human face, and the rules are less mysterious than the infographic link building seem. The short version: personalize the first sentence, prove you read their page, and make the ask trivially easy to say yes to.
Here are the infographic link building best practices I’ve seen hold up across hundreds of sends.
- Name the specific page and section where your asset would fit. Generic “I thought this might interest you” emails get deleted.
- Keep the subject line under 55 characters. Descriptive beats clever every time.
- Send Tuesday through Thursday, morning in the recipient’s time zone. Monday inboxes are chaos; Friday inboxes are abandoned.
- Offer something first. A data point they can cite, a correction, or a complementary resource — before you ask for anything.
- Follow up once, then stop. Repeated follow-ups damage your domain reputation and the sender’s patience.
- Log every send. A CRM or a spreadsheet, doesn’t matter — but track who responded and what they said.
One more thing: don’t pull the “no link, no partnership” move. If a publisher genuinely loves the asset and includes it without a link, thank them anyway. Those relationships pay back later, often in a way you can’t forecast.

Pitfalls That Quietly Kill Infographic Link Building Campaigns
The failures are predictable, which is the good news. Maintaining clarity across your infographic link building remains essential. Most campaigns don’t die from bad ideas; they die from execution gaps.
Here’s what to watch for.
Pitfall 1: Spinning the Same Graphic Across Niches
Recycling one asset with fresh headlines across unrelated verticals produces a lot of activity and zero credibility. Publishers talk to each other. A generic graphic that shows up in five different inboxes in one week is a repeller, not an attractor.
Tailor the data slice — not the whole asset — to each audience. A thoughtful approach to infographic link building reinforces your qualifications. A single chart is often enough.
Pitfall 2: Embedding Links That Point Backward
Some image hosting tools add a link to the host’s site inside the embed code. Double-check every snippet before you send it, or you’ll spend months earning links that benefit someone else.
Twenty seconds of checking saves an entire campaign’s worth of value.
Pitfall 3: Ignoring the Text Around the Graphic
Every infographic needs supporting prose on the landing page — at least 300 words explaining what the data shows, where the infographic link building came from, and what it means. Many publishers pull that summary text verbatim, which means your words end up on their site with your brand attached.
Skipping the write-up is one of the most common mistakes in infographic link building, and the easiest to fix.

Pitfall 4: Chasing Volume Over Relevance
Forty links from unrelated directories are worth less than eight from sites your ideal client actually reads. Relevance drives referral traffic and topical association; volume alone mostly inflates a dashboard.
Set a relevance threshold before the campaign starts and hold yourself to it.
Frequently Asked Questions
These come up in almost every conversation I have about the format, so here they are in one place.
Do Infographic Links Still Help SEO?
Yes, but only when the asset earns genuine editorial citation. Search engines discount links from obvious placement networks, and they still reward references from pages that serve real audiences. Focus on impact, not count.
How Much Does an Infographic Cost to Produce?
Ranges vary wildly depending on data collection and designer experience. Budget for the research and copywriting before the illustration — those two pieces usually determine the campaign’s success far more than the visual polish.
How Many Links Should One Infographic Earn?
A realistic benchmark for a strong campaign in a competitive niche is 5–15 referring domains in the first quarter, with a slow trickle continuing afterward. Anything above that usually means the data hit a nerve — double down on the angle.
Can I Use an AI Image Generator for the Artwork?
For decorative elements, yes. For data visualization, no — charts need verified numbers and accurate axes, and generative tools are unreliable on both. Keep the visual design human-reviewed even if the draft starts with a prompt.
What’s the Ideal Size for the Embeddable Image?
Aim for something around 800 pixels wide for the embed and offer a high-resolution download separately. That balances page speed with legibility on standard blog layouts.
The Best Link Building Infographic Tips for Long-Term Momentum
One campaign is a test. A series is a moat. The most successful programs I’ve seen treat the format as ongoing infrastructure, not a one-off project.
That means: an annual benchmark survey (repeated with the same questions), a quarterly comparison chart that refreshes as the market shifts, and a rolling resource page that gets updated every time new data lands. Publishers bookmark resource pages; they don’t bookmark one-off images.
The best infographic link building tips I can offer are also the most boring ones: keep the data fresh, keep the pitch honest, keep the tracking tight. Do that for four cycles and the referrals start arriving without a pitch — writers find you.
If you want to go deeper afterward, the natural next step is a proper look at link building through statistics roundups and data-driven PR, since the same pitching muscles carry over and the research habits compound.
Putting the Nine Tactics Into a Working Calendar
Here’s how I’d sequence them if I were starting over with a small team and a modest budget.
| Phase | Tactics | Timeframe | Primary Goal |
|---|---|---|---|
| Research | 2, 3 | Weeks 1–2 | Pick a proven angle and data gap |
| Production | 1, 7 | Weeks 3–5 | Build the asset with original data |
| Technical setup | Checklist (hosting, press kit, embed) | Week 5 | Frictionless publishing |
| Outreach wave 1 | 4, 5 | Weeks 6–7 | Warm pitches to resource curators |
| Outreach wave 2 | 6, 8 | Weeks 7–9 | Repurposed posts + broken-link swaps |
| Review | 9 | Week 10 | Double down on the winners |
Ten weeks is realistic for a first cycle. After that, the cadence speeds up because you already have templates, a source list, and a baseline to measure against.
Don’t try to run all nine tactics simultaneously on your first attempt. Pick four — one creation, one technical, two outreach — and earn a result you can point to.
Making Infographic Link Building Part of a Broader Content Strategy
Zoom out for a second. Infographics are one branch of a much larger tree, the one that starts at content-led link acquisition and branches into guest posting, digital PR, resource page building, and statistic-driven pitches.
Treat the infographic as an entry point. The survey you run for the graphic can feed a guest article. The comparison chart can support a landing page. The pitch list becomes your outreach database for everything you publish afterward.
The infographic link building’s the shift that separates a one-time campaign from a durable channel. Build the asset, but build the relationships around it, because the second campaign is always easier than the first — and the third easier still.
Get the first cycle done, measure honestly, and let the data tell you which tactic deserves the next investment. That’s the whole game.
For verified reference and background research, consult the authoritative informational resource on this topic.