The shift from Universal Analytics to Google Analytics 4 is the biggest structural change the web analytics world has seen in a decade, and if you are still asking what actually separates ga4 vs universal analytics, this breakdown is for you.
Google retired the old property type, and every site owner who wants reliable reporting has since had to rebuild their measurement thinking from the ground up.
Here is the honest truth: most people treat the migration as a simple switch. Focusing on ga4 vs universal analytics provides clear direction here. Install the new tag, keep the old dashboards, and carry on.
That approach breaks fast. The two platforms measure different things, count users differently, and even define a “session” in ways that produce wildly different numbers for the same audience.
So I want to walk you through the seven differences that genuinely matter. Not a laundry list of every feature change, but the seven that will change how you read your reports, how you set up tracking, and how you brief your team.
Think of this as a practical ga4 vs universal analytics guide built from real migration headaches rather than vendor slides.
If you manage a website, run paid campaigns, or report to a client on traffic performance, stay with me. By the end you will know exactly which numbers to trust, which legacy habits to drop, and what a sane ga4 vs universal analytics checklist looks like before you call your migration finished.
Why the GA4 vs Universal Analytics Comparison Still Confuses Smart Marketers
Universal Analytics was built in an era of desktop sessions and cookie-based user IDs. Refining each detail of your ga4 vs universal analytics strengthens this section. It thought in sessions, pageviews, and a funnel you defined in advance.
GA4 was built for a world of apps, cross-device journeys, and privacy constraints, so it thinks in events and users instead.
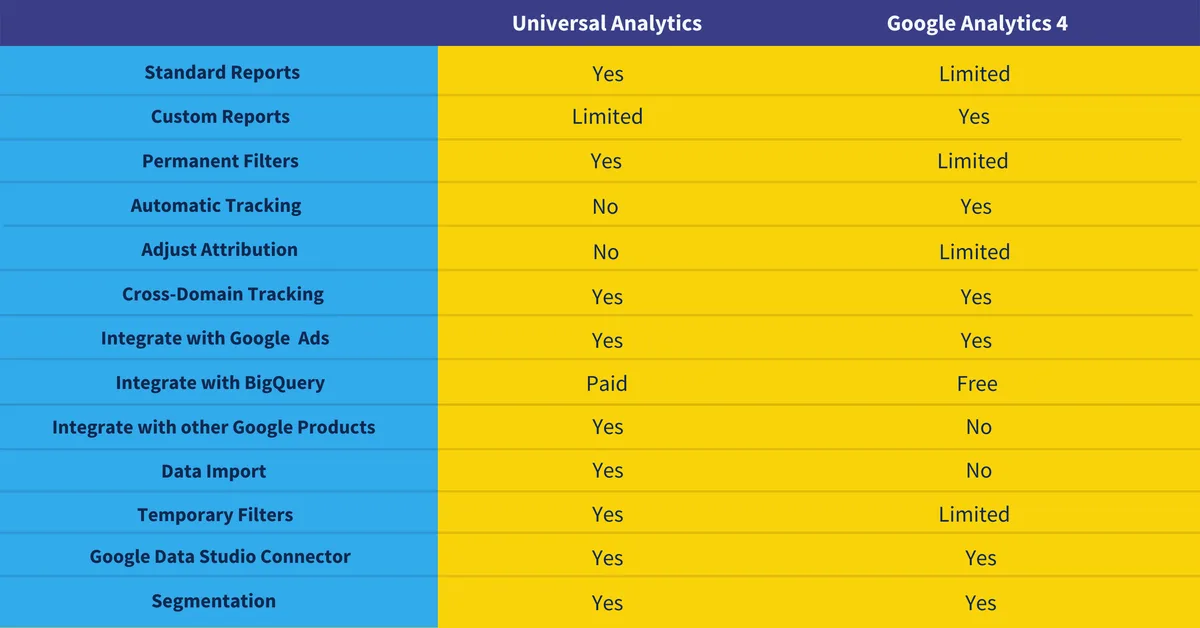
That philosophical gap is the root of nearly every reporting surprise you have hit. When a client says “traffic dropped 40% after migration,” they are usually not looking at a technical failure at all. They are looking at two different measurement models producing two different numbers from the same audience.
I have seen teams waste weeks chasing “lost traffic” the ga4 vs universal analytics was never lost. The old property counted a session differently, attributed a conversion differently, and treated a returning visitor differently. Once you understand why, the panic fades and the numbers start to make sense again.
The Seven Differences That Actually Change Your Reports
Everything below is ordered by how much impact each difference has on day-to-day decision making. Some are structural, some are technical, and one or two will quietly cost you money if you ignore them. Read this section as the core of any ga4 vs universal analytics best practices conversation.
Each difference gets its own treatment: what changed, why it changed, and what you should do about it. Where it helps, I have included a concrete example so you can see the gap in real numbers rather than abstract theory.
1. Data Model: Sessions and Pageviews versus Events and Parameters
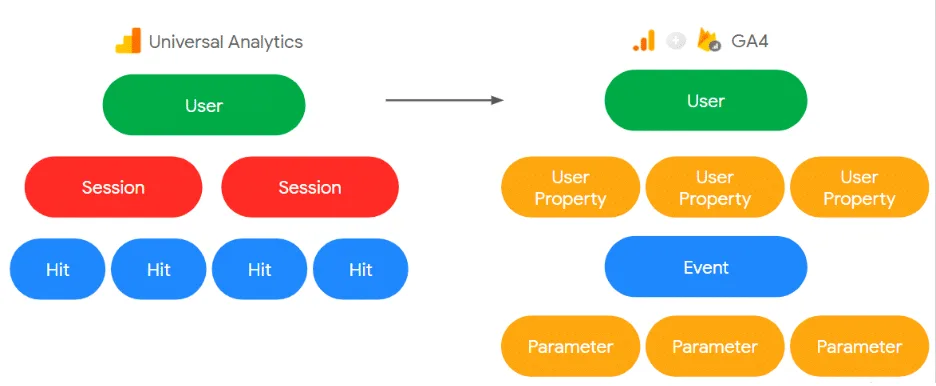
Universal Analytics ran on a hit-based model. Maintaining clarity across your ga4 vs universal analytics remains essential. You sent pageviews, events, and transactions, and the platform stitched them into sessions using a session ID. Everything revolved around that session concept, which is why your old reports were full of session duration and pages per session.
GA4 runs on an event-driven model. Every interaction is an event with parameters attached, and sessions are derived from those events rather than being the primary unit. A page view is now just an event named page_view, sitting alongside scroll, click, and file_download.
The practical consequence is freedom and responsibility in equal measure. A thoughtful approach to ga4 vs universal analytics reinforces your qualifications. You can now send any event name with any parameter you like, which means you can finally model a “quote request” exactly as it happens on your site. But nobody is going to do that for you.
In a side-by-side ga4 vs universal analytics test on the same storefront, the old property showed four distinct event categories. The new one showed forty-one events in the first week, most of them automatically collected. That is the upside and the messiness of the event model in one sentence.
My advice: define a naming convention before the ga4 vs universal analytics send a single custom event. Lowercase, underscore-separated, no spaces, and a written list shared with your developers. Without that discipline, your event list becomes unreadable within a quarter.
2. Metric Definitions: Why Your Bounce Rate Disappeared
Bounce rate in Universal Analytics was a hard failure metric. Structuring your ga4 vs universal analytics around proven patterns ensures impact. A session with a single interaction and no further hits counted as a bounce, full stop. That meant a visitor who read a long article for four minutes and left was still a bounce.
GA4 replaced it with engagement rate, which counts the opposite: sessions that lasted ten seconds or more, had a conversion event, or involved two or more page views. In other words, the new model asks “did anything meaningful happen?” rather than “did they leave after one hit?”
Session duration is another one the ga4 vs universal analytics trips people up. The old platform tracked time on a page using timestamps between hits. GA4 introduces engaged sessions and engagement time, which can look dramatically lower because it measures foreground activity instead of raw timestamps.
Here is a comparison table that maps the old terminology to the new one, since this is the part of ga4 vs universal analytics that gets quoted in board meetings:
| Universal Analytics | GA4 Equivalent | What Changed In Practice |
|---|---|---|
| Bounce Rate | Engagement Rate | Inverted logic; a long single-page read now counts as engaged |
| Session Duration | Engagement Time / Average Session Duration | Foreground activity only, no idle tab time |
| Pages Per Session | Views Per Session | Same idea, now derives from events |
| Total Users | Total Users / Active Users | Active Users requires an engaged session; numbers fall |
| Goal Completions | Conversions (key events) | Goals replaced by explicitly marked events |
| Pageviews | Views (page_view event count) | Identical concept, event-based origin |
Keep this table handy during your first month. When someone questions a metric, you can show them exactly why the definition shifted instead of arguing about whether the tag is broken.
3. Tracking User Journeys Across Devices and Apps
Universal Analytics had a separate property type for apps and never really unified web and app behavior into one identity. Proper attention to your ga4 vs universal analytics sets a strong baseline. A customer who browsed on a phone and purchased on a laptop showed up as two users, and your attribution suffered accordingly.
GA4 was designed around a single data stream concept. Web, iOS, and Android can all report into one property, and user identity ties them together through the user_id parameter when you can pass it. That is a genuine improvement for anyone with a product ecosystem.
I have used the ga4 vs universal analytics feature to fix attribution for a subscription business where the signup happened in an app but the marketing touchpoint happened on the web. In the old setup, paid search looked useless. In GA4, with user_id joined through a login event, the true assisted conversions appeared.
The catch is that cross-device identity only works if you implement user_id properly and your consent flows allow it. If you stop at the default setup, you get none of the benefit and all of the reporting confusion.
That is a recurring theme in any ga4 vs universal analytics checklist: the new platform gives you more capability, but only when you actually configure it. Defaults are deliberately conservative.
4. Reporting Interface: Exploration versus Prebuilt Reports
Universal Analytics handed the ga4 vs universal analytics a dense left-hand menu of prebuilt reports. Custom reports and segments gave you flexibility, but the underlying structure was fixed. That was comfortable and also limiting.
GA4 flipped the balance. Some standard reports exist, but the real work happens in Explorations, where you build freeform tables, funnels, path analyses, and cohort views yourself. It feels bare at first and powerful later.
The learning curve is real, and I will not pretend otherwise. Integrating ga4 vs universal analytics into your workflow produces consistent quality. Teams that expect the old menu tree get frustrated within a day.
What helps is building three or four saved exploration templates early: traffic by source, conversion by landing page, and engagement by device.
Once those templates exist, the interface stops feeling empty and starts feeling like a proper analysis tool. New hires can then be pointed at saved explorations instead of being asked to rediscover the platform from scratch.
5. Data Retention and Historical Data Limits
The ga4 vs universal analytics one has bitten more than a few organizations six months late. Universal Analytics kept event-level and user-level data for a long time by default, which encouraged a certain complacency about exports.
GA4 caps event data retention at fourteen months on the free tier, with options for two and fourteen months depending on your property settings. If you never change the default, you may find last year’s granular data silently gone.
The fix is mundane but essential: set retention to the maximum available, and export anything the ga4 vs universal analytics care about into BigQuery or a warehouse on a schedule. Relying on the interface as your archive is a mistake regardless of which platform you are running.
I would go further. Before you start comparing ga4 vs universal analytics numbers month by month, make sure both properties have exports running. Otherwise you will be doing forensic archaeology instead of analysis.
6. Consent, Data Privacy, and Modeling
Universal Analytics was largely built before GDPR and the wave of state-level privacy laws reshaped the industry. Consent was bolted on through configuration, and the platform assumed fairly liberal data collection.
GA4 ships with consent mode built into the architecture. You can specify how tags behave when a user declines tracking, and Google applies behavioral modeling to estimate the gaps. The result is more legally defensible measurement, though the modeling requires a healthy amount of traffic to be useful.
If your audience is small, modeling will not rescue your numbers, and you should lean on first-party data instead. That might mean a lightweight lead form, a newsletter signup, or server-side event collection where it makes sense.
This is where the ga4 vs universal analytics comparison becomes a compliance question rather than a tooling one. A property that collects aggressively but illegally is worth less than a property with smaller numbers you can defend.
7. Conversion Tracking and the Shift to Key Events
Universal Analytics had Goals: destination, duration, pages per session, and event goals. You configured them once and they governed which sessions counted as successful.
GA4 marks events as conversions directly, and Google has since rebranded the most important of these as key events. There is no separate goal configuration step, just an event you flag. It is simpler, and also easier to flag the wrong thing by accident.
In one audit I reviewed, a client had marked scroll and page_view as conversions out of curiosity. Their conversion rate read 94 percent and every downstream report became decorative. Cleaning that up took ten minutes and restored the dashboard’s credibility.
So here is a practical tip from an implementation standpoint: keep a written register of which events are flagged as key events, who approved them, and what business question each answers. Treat it like a controlled list, because that is what it is.
The conversion model change is also the reason your old goal funnel does not translate directly. Build a proper exploration funnel using events, and test it against known traffic patterns before publishing anything to stakeholders.
A Practical GA4 vs Universal Analytics Guide to Migrating Your Measurement Setup
Reading differences is one thing. Rebuilding a measurement plan that survives contact with reality is another. This section is the working part of the ga4 vs universal analytics guide, aimed at the people doing the configuration rather than the people signing off on it.
The order matters more than the completeness. Teams that try to do everything at once end up with half-finished tracking and no confidence in any number. Do it in phases and validate each phase before moving on.
Step One: Audit What You Actually Measured Before
Start by exporting your old event list, goal list, and custom dimension list. For each one, write the business question it answered. If you cannot articulate the question, you probably do not need to recreate it.
I usually group the surviving items into three buckets: acquisition, engagement, and conversion. Anything that does not fit one of those buckets gets archived rather than migrated. That single decision keeps your new property lean.
Run the ga4 vs universal analytics audit with whoever consumes the reports, not just whoever built them. Analysts often keep metrics alive long after the stakeholder who requested them has moved roles.
Step Two: Build the Event and Parameter Naming Convention
Write down your naming rules and publish them where developers will see them. Lowercase with underscores, no abbreviations that only one person understands, and parameters named for what they hold rather than where they came from.
Include a small glossary too. When someone asks what the parameter item_category actually contains on your site, the answer should be in the ga4 vs universal analytics document rather than in someone’s memory.
If you take only one tip from this whole ga4 vs universal analytics piece, take this one: the naming convention costs an afternoon and saves months. It is the cheapest high-impact step in the entire migration.
Step Three: Configure Key Events and Test Them Reliably
Rebuild your conversion list as events, flag the important ones as key events, and test each one with a real interaction. The debug view and a tag management preview are your friends here.
Do not trust a new conversion until the ga4 vs universal analytics have seen it fire once from a real browser session. Automated test suites are useful, but they miss the classic failure modes: forms that submit via JavaScript, thank-you pages that redirect, and buttons that fire twice.
Then run a short parallel period. Keep both properties reporting for a couple of weeks, compare the conversion counts, and document every discrepancy you can explain. What remains unexplained is your to-do list.

Step Four: Retire Legacy Dashboards Honestly
Old dashboards the ga4 vs universal analytics mix metric names from Universal Analytics with data from GA4 are worse than no dashboards. They look authoritative and are quietly wrong. Retire them, and rebuild the handful that people actually open.
When you rebuild, add a definition line under each metric. “Engagement rate equals engaged sessions divided by total sessions” takes one line and prevents a hundred confused messages.
Finally, keep a short ga4 vs universal analytics tips sheet pinned for the first quarter. Metric definitions, key events, and the retention setting. It sounds basic. It is the difference between a confident team and a team arguing about bounce rate for six weeks.
Common Mistakes That Break a GA4 vs Universal Analytics Migration
Most failed migrations fail for predictable reasons. None of them are mysterious, and all of them are avoidable if you know what to watch for. Here is the shortlist I check on every audit.
Assuming the tag is broken because numbers fell. Users, sessions, and engagement time all drop after migration for definitional reasons. Compare like with like before you file a bug.
Leaving retention at the default. If nobody changed the ga4 vs universal analytics, event data is disappearing faster than you think. Check the setting today and export anything you need to keep long term.
Flagging too many key events. A conversion list with twelve entries tells you nothing. Pick three to five that map to revenue or pipeline, and leave the rest as plain events.

Skipping the consent configuration. Legal teams care about the ga4 vs universal analytics more than marketing teams do. Sort it out before an audit forces the issue, and test the behavior with consent denied.
Treating Explorations as optional. The standard reports are a starting point, not a replacement for the old custom reports. Book time to build templates, or your reporting will stall.
The last mistake deserves its own mention because it is the most common one I encounter in practice. Teams compare ga4 vs universal analytics figures side by side for a single month and conclude the new platform is undercounting, when what they are really seeing is an unresolved definition mismatch.
Quick Reference: What to Hand Your Team Before Launch
Documentation is the least glamorous part of analytics work and the part the ga4 vs universal analytics determines whether your work survives staff turnover. A one-page brief beats a forty-page manual every time.

The list below is the ga4 vs universal analytics checklist I would want if I were inheriting a property from a colleague. It is deliberately short enough to actually get finished.
- Property and data stream inventory. List every stream, its URL, and its owner. Include the measurement ID for each so nobody has to hunt through tag manager later.
- Event naming convention document. Lowercase, underscore-separated, with a glossary of parameters. Store it where developers already look for documentation.
- Key event register with owners. Three to five flagged events, each tied to a business question and a named approver. Review it quarterly rather than annually.
- Retention and export configuration. Confirm retention is set to the maximum and that an export pipeline exists for anything you need beyond that window.
- Consent mode behavior tested. Verify that tags behave as expected when a visitor declines, and record the test date and result.
- Dashboard definitions. Every metric on a live dashboard carries a one-line definition so nobody reinterprets engagement rate on a whim.
- Comparison window plan. Decide which previous periods you will use for benchmarking, and state explicitly which old metrics have no direct equivalent.
If you complete those seven items, you are ahead of most organizations. The rest is refinement, and refinement is a monthly habit rather than a launch activity.
What Comes After the Migration
Once the new property is stable, the interesting work begins. That is where ga4 vs universal analytics best practices stop being about translation and start being about capability: predictive audiences, modeled conversions, and warehouse-level analysis that the old platform could never support.
The natural next step for most teams is connecting the property to BigQuery. Developing your ga4 vs universal analytics with precision highlights key strengths. That unlocks unaggregated event data, retention analysis beyond the platform limit, and joins with CRM or billing data. If you already have a warehouse, wire it up early.

The second step is audience strategy. GA4 lets you build audiences from event conditions and export them to advertising platforms, which turns analytics from a reporting function into a targeting one. That change alone justifies the migration effort.
A third area worth planning is experimentation. Clear alignment with your ga4 vs universal analytics builds confidence from the start. With proper event tracking in place, you can measure the effect of a page change or a pricing test without juggling a second analytics tool. It is not built in, but the data foundation finally supports it.
None of this happens by default, which is the honest lesson of the entire ga4 vs universal analytics story. The new platform gives you a broader canvas and leaves the painting to you.
Risks, Costs, and Who Should Care About This
Migration carries real costs, and pretending otherwise helps nobody. There is implementation time, training time, and a period of reduced confidence in your numbers. For a mid-sized site, that is usually measured in weeks rather than days.

The technical cost depends on how custom your old tracking was. Sites with straight pageview and transaction tracking move quickly. Sites with deep custom dimensions and event-based funnels need a proper build, and that work should be scoped like any other software project.
There is also a risk of over-collection. GA4 makes it easy to send everything and store everything, which creates privacy exposure and a maintenance burden. Ask, for every new event, whether you will ever act on it.
As for who should care: e-commerce teams because revenue attribution shifts, content teams because engagement rate replaces bounce rate, paid media teams because cross-device identity affects bidding, and finance because compliance depends on the ga4 vs universal analytics. In other words, almost everyone who touches the website.
External resources worth reading include the official GA4 documentation from Google and the broader web analytics overview on Wikipedia, which helps frame the ga4 vs universal analytics comparison in a longer historical context.
Questions People Ask About GA4 vs Universal Analytics
These are the questions that come up in nearly every workshop and audit conversation. Short answers first, then the detail that actually matters.
Is GA4 More Accurate Than Universal Analytics?
It is more honest about what it measures, which is not the same as more accurate. GA4 excludes idle time from engagement, requires an engaged session before counting an active user, and relies on consent mode where applicable. Those choices all push numbers down, but they reflect real behavior more faithfully than a timestamp hack from.
Why Did My Traffic Drop After the Migration?
Almost always because of definitions, not lost visitors. Active users, engaged sessions, and session counts behave differently on the new platform. Compare a like-for-like period, check your retention and tagging setup, and review the session_start event before assuming a technical fault.
Can I Still Access My Old Universal Analytics Reports?
Standard properties have been retired, so the ga4 vs universal analytics are working from exports rather than the live interface. If you have not already exported your historical data, do it now if it is still available to you. Teams that skipped this step have had to reconstruct quarterly reporting from memory and spreadsheets.
What are the Most Important GA4 vs Universal Analytics Tips for Small Teams?
Keep it simple. Define three key events, set retention to the maximum, build two saved explorations, and write one page of metric definitions. Small teams fail from over-engineering far more often than from missing features.
Do I Still Need a GA4 vs Universal Analytics Checklist After Migration?
Yes, because configuration drifts. New people join, legacy tags linger in tag manager, and someone flags an event as a key event out of curiosity. A checklist reviewed quarterly catches that drift before your reporting depends on it.
Does the Event Model Replace Goals Entirely?
In effect, yes. Conversion tracking now runs through events you flag, and the concept of an independent goal object is gone. The replacement is simpler to configure, which is why governance around which events get flagged matters so much.
How Long Does a Full Migration Usually Take?
For a straightforward marketing site, a couple of weeks of configuration plus a parallel tracking period. For a site with custom funnels, e-commerce tracking, and consent requirements, plan for a proper scoped project with dedicated developer time. The parallel period is not optional in either case.
The Short Version, if You Only Remember One Thing
Every meaningful difference in this ga4 vs universal analytics comparison points to the same conclusion: the new platform gives you more control and requires more discipline in return. Nothing important happens by default.
If you define your events carefully, set retention properly, mark a small set of key events, and document your metric definitions, you will get better answers than the old platform ever gave you. Skip those steps and you will spend the next year arguing with your own dashboard.
Start with the audit, keep the parallel tracking period honest, and hand your team the one-page checklist. Effective execution in your ga4 vs universal analytics makes a tangible difference. That is the whole strategy, and it works.