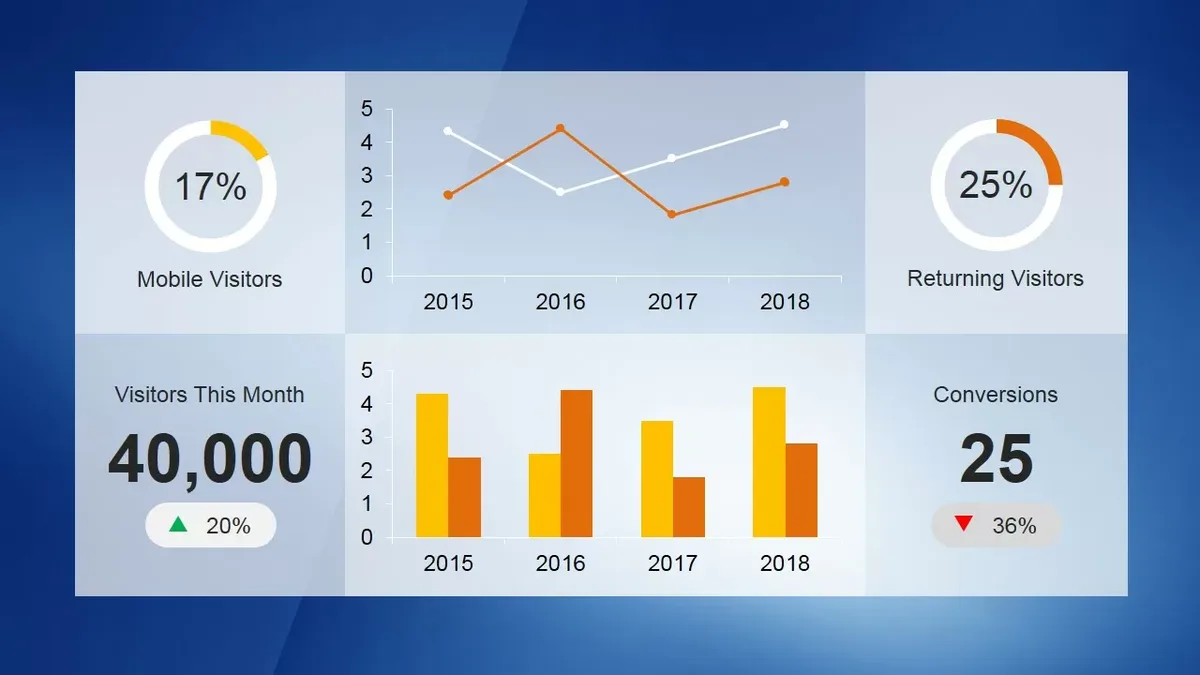
If you have ever stared at an analytics dashboard and felt your eyes glaze over, you are not alone. A solid web KPI framework cuts through that noise and tells you exactly which numbers deserve your attention.
This guide walks you through the metrics that actually move the needle, how to pick them without drowning in data, and how to turn raw figures into decisions that grow your site.
Let’s be honest: most site owners track too much and understand too little. They obsess over pageviews while ignoring bounce patterns, or they celebrate traffic spikes that never convert into revenue. The fix isn’t more data. It’s the right data, framed as a web KPI you can act on every single week.
By the end of this piece, you will know how to build a measurement system that fits your goals, whether you run a small blog, a bustling e-commerce store, or a SaaS platform with thousands of daily users.
What a Web KPI Actually Means
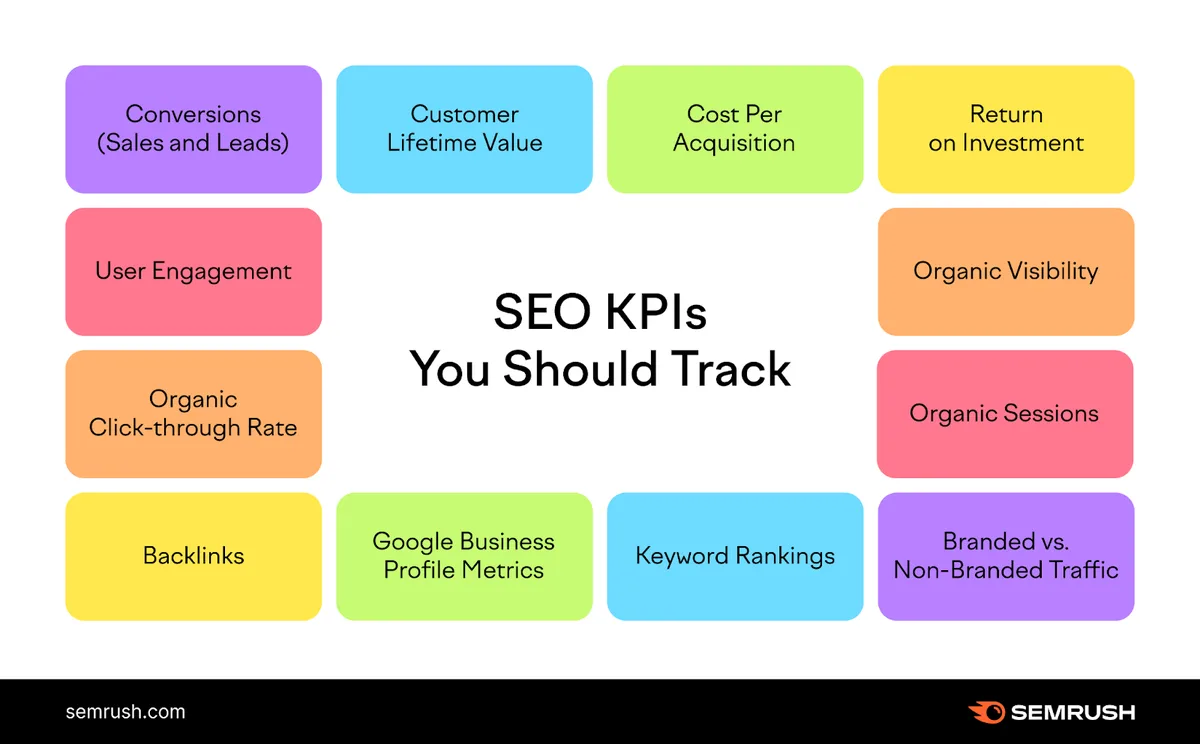
A web KPI is a quantifiable measure tied to a specific objective for your website. It is not just any statistic you can pull from Google Analytics. The word “key” does the heavy lifting here. If a number doesn’t influence a decision, it isn’t key — it’s trivia.

Think of it this way. Your car dashboard shows speed, fuel level, and engine temperature. It doesn’t show the exact voltage of your alternator, even though that data exists somewhere. A web KPI works the same way. It surfaces what matters right now so you can steer.
The confusion usually starts when teams treat every metric as a KPI. Suddenly you have forty numbers on a report, nobody reads it, and the whole exercise collapses. The discipline is in the subtraction, not the addition.
The Difference Between a Metric and a KPI
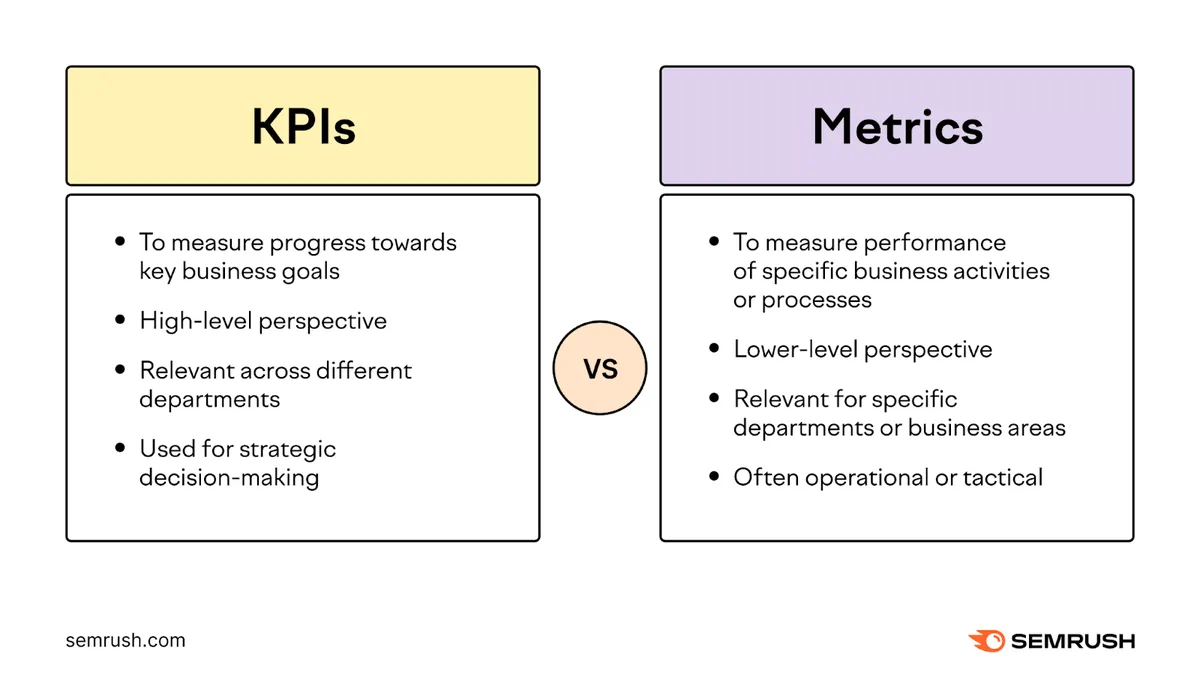
Every KPI is a metric, but not every metric is a KPI. A metric is a raw measurement — sessions, scroll depth, form submissions. A web KPI is a metric you have chosen because it maps directly to a business outcome you care about.
Say you run a subscription newsletter. Total pageviews might be a metric you glance at. Email signups per thousand visitors is a web KPI, because it tells you whether your content is doing its actual job.
Here’s a practical test. Ask yourself: “If this number doubled or halved, would I change what I’m doing?” If the answer is no, demote it to a metric and move on.
Why Context Beats Raw Numbers Every Time
A bounce rate of 70 percent sounds alarming until you realize it’s a single-page recipe blog where readers find what they need and leave satisfied. The same figure on a checkout page would be catastrophic. Context is everything.
This is where a lot of web KPI advice goes wrong. People quote industry benchmarks as if they were universal laws. They aren’t. Your baseline matters more than anyone else’s average.

So before you chase a target, measure where you stand for a few weeks. That baseline becomes the reference point for every future comparison.
How to Choose Web KPI That Fit Your Goals
Picking the right web KPI starts with clarity about what your site is supposed to do. A lead-generation page and a news portal have almost nothing in common when it comes to success. Naming your primary objective first saves you months of measuring the wrong things.
I’ve watched teams burn entire quarters optimizing metrics that had zero connection to revenue. They’d celebrate a 30 percent jump in time-on-page while sales flatlined. The lesson? Anchor every web KPI to a business result, not a vanity figure.

Once your objective is locked, the metric selection becomes almost mechanical. You work backward from the outcome to the behavior that drives it.
Start With the Business Outcome, Not the Tool
Resist the urge to open your analytics platform and browse for interesting numbers. That’s backwards. Start on a whiteboard or a blank doc and write down the one thing your site must achieve this quarter.

Maybe it’s generating qualified demo requests. Maybe it’s reducing support tickets by answering common questions. Whatever it is, that outcome dictates your web KPI hierarchy.
Tools come last. They just report what you’ve already decided to care about. Letting software define your priorities is how you end up with a dashboard full of noise.
Match Metrics to the Funnel Stage
Different stages of your funnel need different web KPI. Top-of-funnel cares about reach and discovery. Middle-of-funnel cares about engagement and consideration. Bottom-of-funnel cares about conversion and retention.
Tracking a conversion metric when you have almost no traffic is demoralizing and useless. You can’t convert visitors you don’t have. Fix the top of the funnel first.
Conversely, if you have plenty of traffic but weak sales, your web KPI should shift toward the lower stages. Diagnose the stage that’s leaking, then measure there.
Core Web KPI for Traffic and Reach
Traffic metrics are the most familiar category, and also the most abused. Everyone loves a rising visitor count, but reach without relevance is just expensive noise. Use these web KPI carefully and always pair them with a quality signal.
The goal here isn’t to worship volume. It’s to understand whether the right people are finding you through the right channels.
Unique Visitors and Sessions
Unique visitors tell you how many distinct people showed up. Sessions tell you how many visits occurred, including repeat trips. The gap between them reveals loyalty.
If your sessions vastly outnumber unique visitors, you have a returning audience — a healthy sign. If they’re nearly equal, most people visit once and vanish. That’s a web KPI worth investigating.
A practical tip: segment these numbers by acquisition channel. Organic search visitors behave very differently from paid social, and blending them hides the truth.
Traffic Source Distribution
Where your visitors come from shapes everything downstream. A site dependent on a single channel is fragile. One algorithm update can wipe out half your traffic overnight.
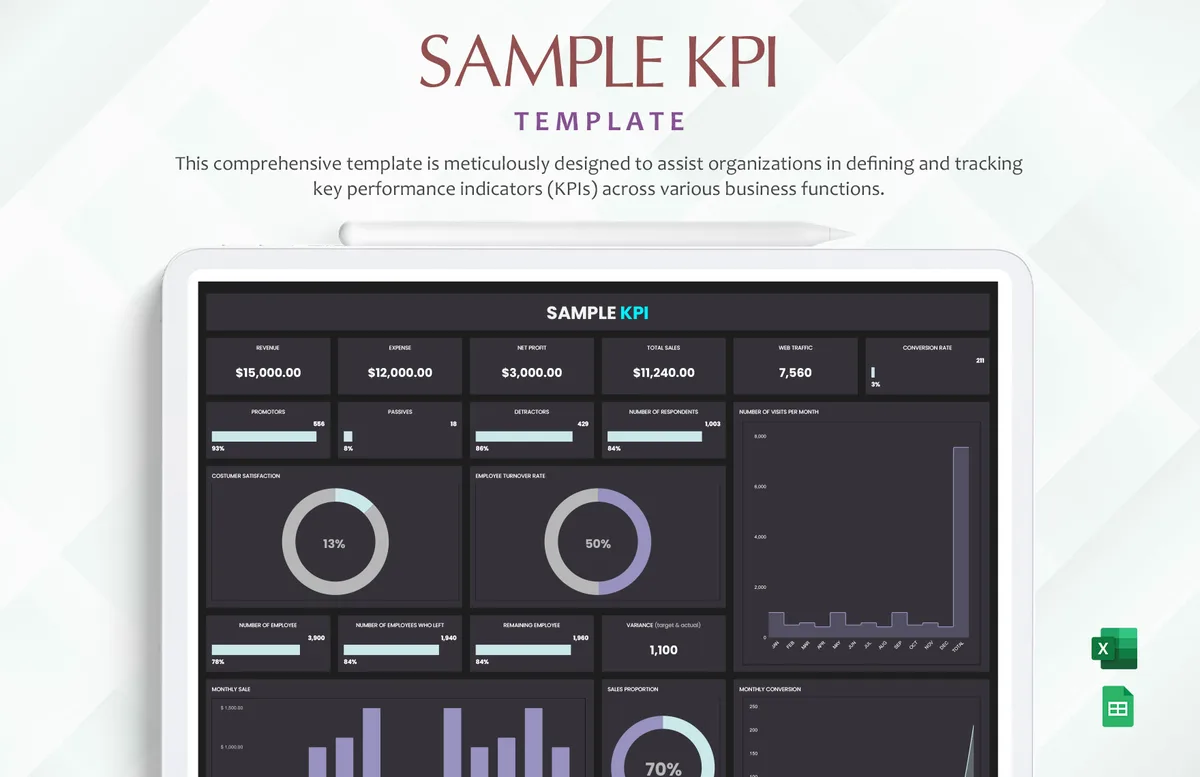
Healthy distribution across search, direct, referral, and social is a web KPI that signals resilience. Watch for sudden shifts — they often precede bigger problems.
I once saw a client lose 60 percent of traffic in a week because they’d built everything on one social platform. Diversification isn’t paranoia. It’s insurance.
New versus Returning Visitor Ratio
This ratio tells a story about your content’s reach and your brand’s stickiness. A healthy site attracts newcomers while keeping a loyal core coming back.
If almost everyone is new, you may be great at acquisition but weak at retention. If almost everyone is returning, you might be failing to reach fresh audiences.
Neither extreme is ideal. Treat the balance as a web KPI and adjust your content strategy accordingly.
Engagement Web KPI That Reveal Real Interest
Engagement metrics answer a simple question: are people actually reading, or just landing and leaving? This category separates meaningful visits from accidental ones, and it’s where a lot of web KPI programs quietly fail.
High traffic with low engagement is a warning sign. It means you’re attracting the wrong audience or your content isn’t delivering on its promise.
Average Time on Page and Session Duration
Time on page estimates how long someone spent with your content. Session duration aggregates that across all pages in a visit. Both are imperfect but useful.
The caveat: a single-page visit with no further interaction can register as zero seconds, skewing your averages. Keep that in mind before panicking.
Use this web KPI as a relative measure. Compare pages against each other rather than chasing an absolute target.
Scroll Depth and Content Consumption
Scroll depth tracks how far down a page visitors travel. If 80 percent of readers never reach your key call-to-action, that placement is wasted.
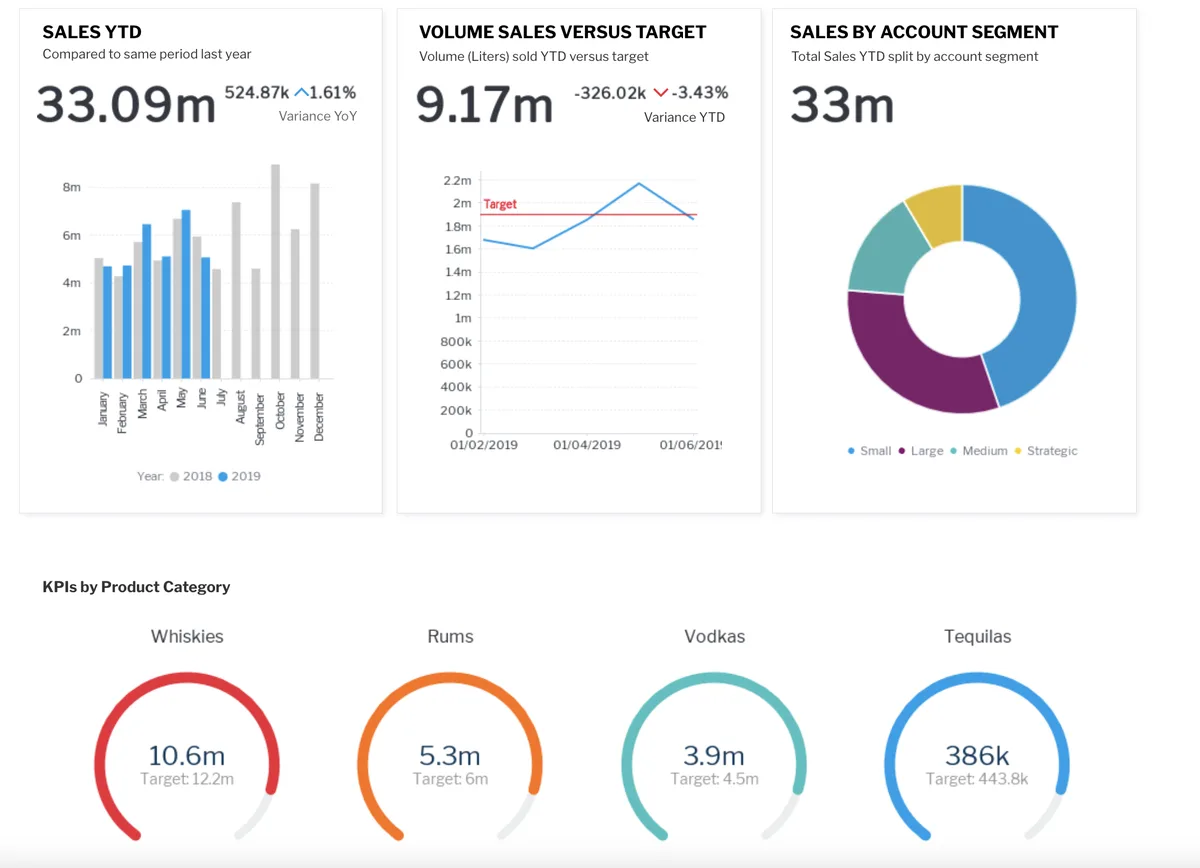
This is one of the most actionable web KPI in the engagement family. It tells you exactly where attention drops off, so you can restructure the page.
Pair it with heatmaps for a fuller picture. Numbers show what happened; visuals show why.
Bounce Rate and Exit Rate
Bounce rate measures single-page sessions. Exit rate measures how often a page is the last one viewed. They sound similar but mean different things.
A high bounce rate on a landing page might be fine if that page answers the query completely. A high exit rate on a mid-funnel page usually signals a problem.
Interpret both through the lens of intent. That’s the only way this web KPI becomes useful instead of confusing.
Conversion Web KPI That Tie to Revenue
This is where measurement meets money. Conversion metrics are the web KPI most executives actually care about, and for good reason. They connect website activity to business results.
Without conversion tracking, you’re flying blind. You might have beautiful traffic and engagement numbers while the business quietly bleeds.
Conversion Rate by Page and Segment
Conversion rate is the percentage of visitors who complete a desired action. Computing it site-wide is fine, but segmenting reveals the gold.
Break it down by page, traffic source, device, and geography. You’ll often find that one segment converts ten times better than another — a web KPI insight worth its weight in gold.
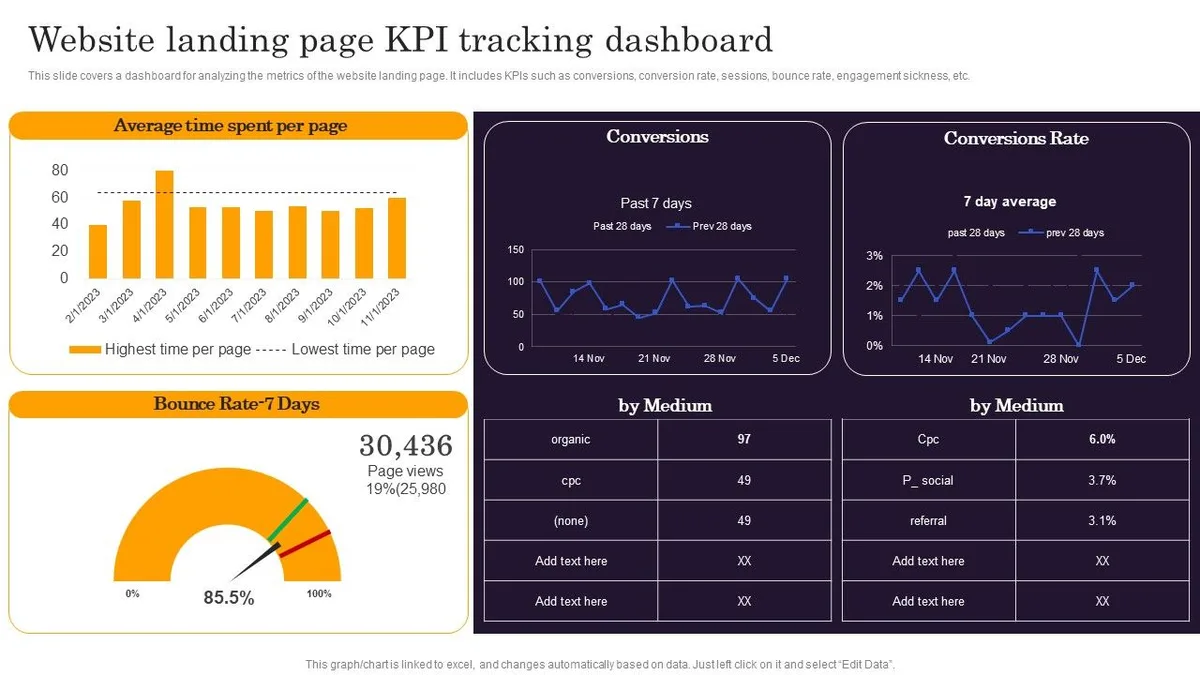
Double down on what works. Fix or cut what doesn’t.
Cost per Acquisition and Return on Ad Spend
If you run paid campaigns, cost per acquisition tells you what each conversion costs. Return on ad spend tells you what you get back. Together they define profitability.
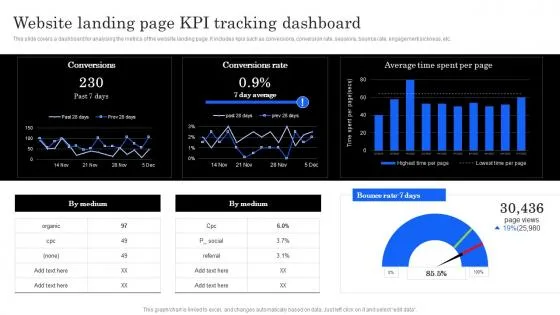
These web KPI matter because they prevent the classic trap of scaling a campaign that loses money on every sale. Volume means nothing if the math doesn’t work.
Track them weekly during active campaigns. Daily fluctuations can mislead; weekly trends tell the real story.
Cart Abandonment and Checkout Completion
For e-commerce, cart abandonment is one of the most painful web KPI to watch. It shows how many shoppers filled a cart and walked away.
Checkout completion rate is its counterpart — the percentage who finish the purchase. The gap between them is where revenue hides.
Small fixes here often yield outsized returns. Simplifying a form or adding a trust badge can move this web KPI more than any ad spend.
| Web KPI | Category | What It Reveals | Typical Action |
|---|---|---|---|
| Unique Visitors | Traffic | Reach and audience size | Expand acquisition channels |
| Traffic Source Mix | Traffic | Channel dependence risk | Diversify referrals |
| Average Time On Page | Engagement | Content relevance | Improve headline and structure |
| Scroll Depth | Engagement | Attention drop-off points | Reposition key content |
| Conversion Rate | Conversion | Persuasion effectiveness | A/B test offers and CTAs |
| Cart Abandonment | Conversion | Checkout friction | Simplify purchase flow |
| Retention Rate | Retention | Long-term value | Improve onboarding |
Technical and Performance Web KPI You Cannot Ignore
Speed and stability are silent killers. A slow site bleeds visitors before they ever see your content, and no amount of great copy fixes that. Technical web KPI deserve a permanent spot on your dashboard.
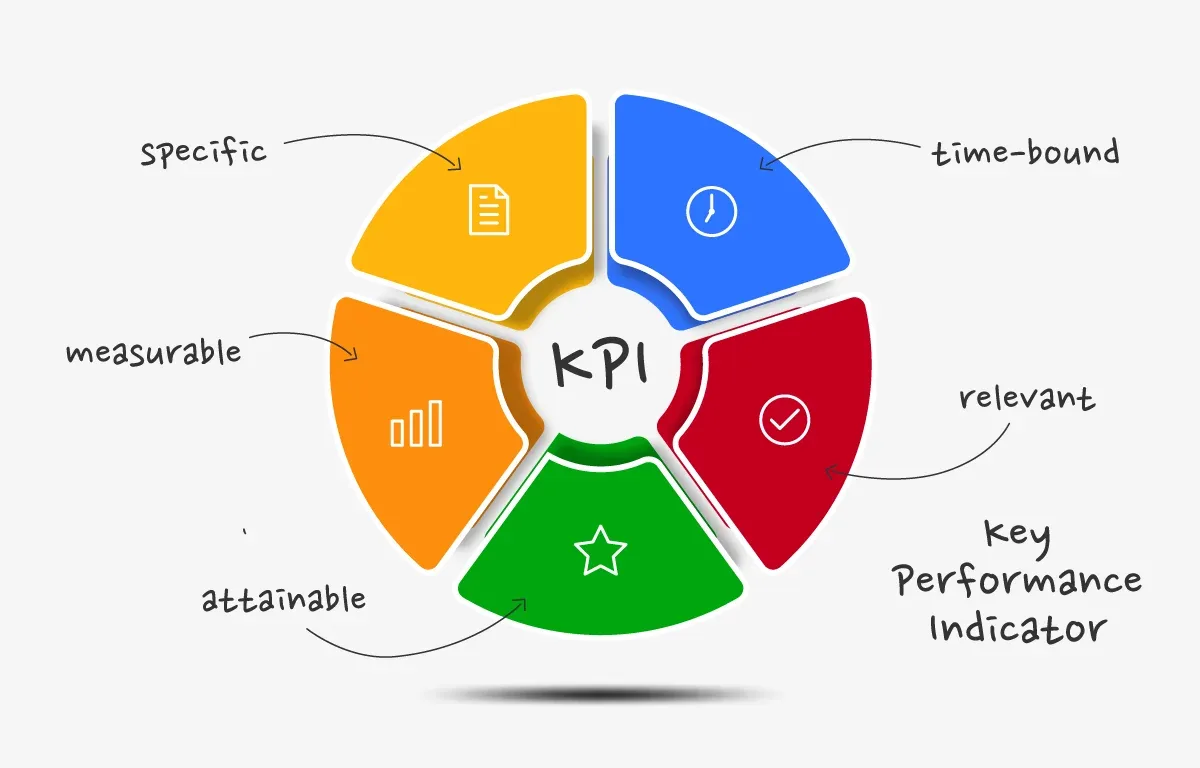
Google’s own documentation on Core Web Vitals makes the case clearly: user experience directly influences search visibility. Ignore it at your peril.
Page Load Time and Core Web Vitals
Page load time measures how long it takes for content to appear. Core Web Vitals add nuance through metrics like Largest Contentful Paint and Interaction to Next Paint.
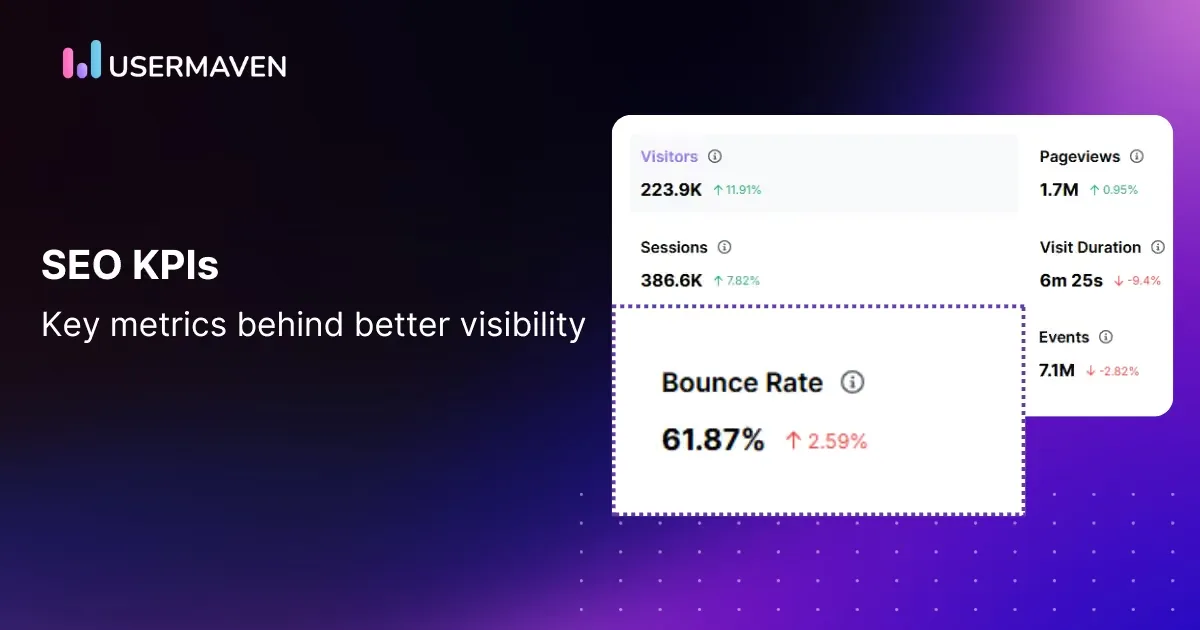
These this practice correlate with both user satisfaction and search rankings. A site that loads in under two seconds consistently outperforms slower competitors.
Test on real devices, not just your fast office connection. Your visitors are on phones in coffee shops with spotty Wi-Fi.
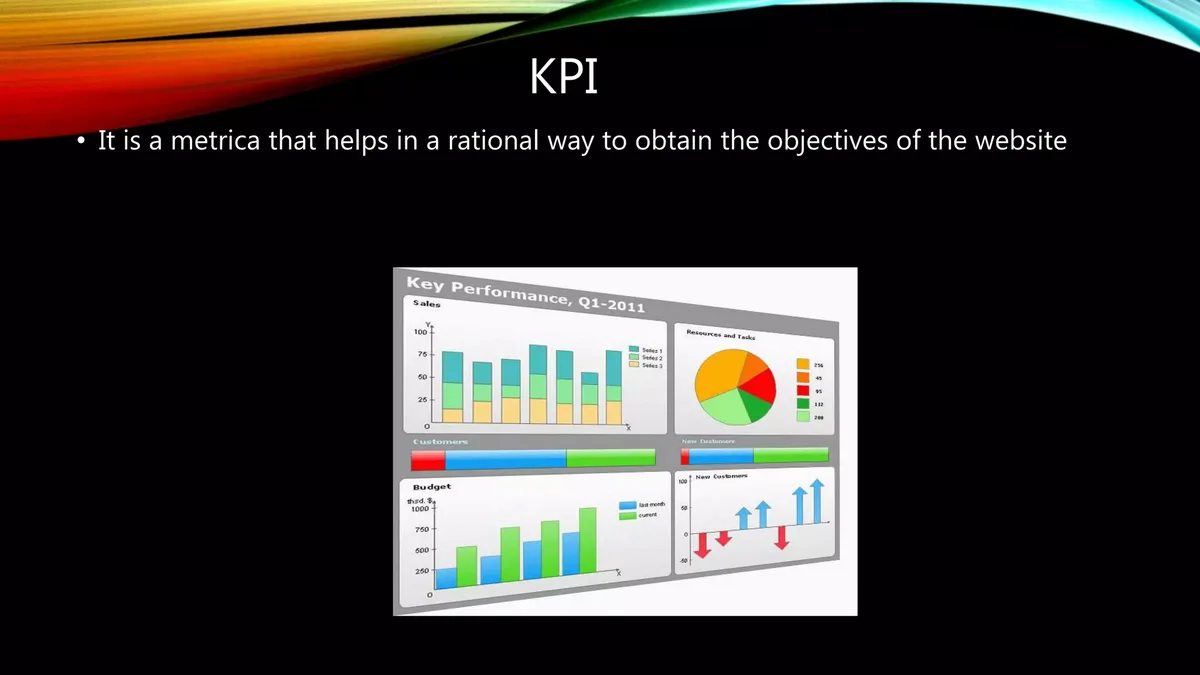
Uptime and Error Rates
Uptime is the percentage of time your site is reachable. Error rates track how often requests fail. Both are foundational this practice that rarely get attention until something breaks.
Set up alerts so you learn about outages from your monitoring tool, not from angry customers. Every minute of downtime has a cost.
A simple uptime target of 99.9 percent still allows roughly forty minutes of downtime a month. Decide what your business can tolerate.
Mobile Responsiveness Metrics
More than half of web traffic now comes from mobile devices. If your mobile experience lags, you’re losing the majority of your audience.

Track mobile-specific this practice like tap target accuracy, viewport fit, and mobile conversion rate. Compare them directly against desktop.
A gap between mobile and desktop conversion is a red flag worth fixing immediately.
Retention and Loyalty Web KPI
Acquiring a customer costs far more than keeping one. Retention metrics reveal whether your site builds lasting relationships or just churns through visitors. These this practice are often overlooked because they’re less flashy than traffic numbers.
But loyalty compounds. A small improvement in retention can transform your unit economics over a year.
Return Visitor Rate
Return visitor rate measures how many people come back after their first visit. It’s a direct signal of whether your content or product earned a second look.
Low return rates suggest your first impression isn’t compelling enough. High rates mean you’ve built something worth revisiting.

Segment this this practice by content type. Some pages naturally attract one-time readers, while others should build a following.
Customer Lifetime Value Signals
Customer lifetime value estimates the total revenue a customer generates over their relationship with you. It’s a strategic this approach that guides how much you can afford to spend on acquisition.

If your lifetime value is high, you can outbid competitors for new customers. If it’s low, every acquisition dollar is precious.
Track it alongside churn to understand the full picture. Rising value plus falling churn is the dream combination.
Subscription and Repeat Purchase Rates
For subscription businesses, the renewal rate is the heartbeat. For e-commerce, repeat purchase rate plays the same role.
These this approach show whether your product or content delivers ongoing value. A declining renewal rate is an early warning that something in the experience has degraded.
Survey churning customers to understand why. The answers often point to fixable issues you’d never spot in the numbers alone.
Building a Web KPI Dashboard That People Actually Use
A dashboard nobody opens is worse than no dashboard at all. It creates the illusion of measurement while driving zero action. The best this approach dashboards are simple, focused, and reviewed on a fixed schedule.
Simplicity wins. If your team needs a training session to read the report, it’s too complicated.
Keep It to Five or Seven Metrics
Research on decision-making consistently shows that people struggle with more than a handful of variables at once. Cap your primary this approach at five to seven.
You can keep a deeper report for monthly reviews, but the daily or weekly dashboard should be ruthlessly lean.
Every metric on the main view should answer the question: “What do I do differently because I saw this?” If there’s no answer, cut it.
Set Realistic Targets and Thresholds
A this practice without a target is just a number. Define what “good” looks like, and set thresholds that trigger action when crossed.
Use your own historical baseline rather than borrowed industry averages. Your context is unique, and so is your path to improvement.
Review targets quarterly. What was ambitious six months ago may now be routine.
Assign Ownership for Every Metric
Metrics without owners drift. Someone needs to be accountable for each this approach, watching it, interpreting it, and proposing fixes when it slips.
Ownership doesn’t mean one person does all the work. It means one person ensures the metric gets attention and the response gets coordinated.
In smaller teams, this might be a single person overseeing everything. In larger organizations, distribute the responsibility across functions.
Common Web KPI Mistakes and How to Dodge Them
Even experienced teams stumble into predictable traps. Knowing them in advance saves months of wasted effort. Here are the ones I see most often, along with practical ways to sidestep each.
Chasing Vanity Metrics
Vanity metrics feel good and mean little. Follower counts, raw pageviews, and social likes often fall into this bucket. They can rise while your business stalls.
Audit your this practice regularly and ask whether each one connects to a real outcome. If it doesn’t, it’s decoration.
Replace vanity figures with ratios and rates. Percentages force you to think about relationships between numbers, which is where insight lives.
Ignoring Segmentation
Blended numbers hide stories. A site-wide conversion rate of 2 percent might mask a mobile rate of 0.5 percent and a desktop rate of 4 percent.
Segment your this approach by device, channel, geography, and user type. The differences you find will reshape your priorities.
Start with the two or three segments most relevant to your business. You can expand later once the habit sticks.
Measuring Without a Baseline
Without a baseline, you can’t tell improvement from noise. Set your starting point before you launch any optimization effort.
Give new this practice a few weeks to stabilize. Early data is often volatile and misleading.
Document your baseline in a shared place. Future you will thank present you for the reference point.
Turning Web KPI Data Into Decisions
Data alone changes nothing. The value comes from the decisions it triggers. This is the step most teams skip, and it’s why so many measurement programs produce reports instead of results.
The rhythm matters. Set a cadence for reviewing your this approach and stick to it, whether weekly, biweekly, or monthly.
Run a Weekly Review Ritual
A short, focused weekly review keeps your this practice top of mind. Thirty minutes is usually enough if your dashboard is lean.
Walk through each metric, note anything unusual, and assign one action per issue. Keep a running log so you can see patterns across weeks.
Consistency beats intensity here. A brief review every week outperforms a marathon session once a quarter.
Prioritize by Impact and Effort
When a this approach slips, you’ll have several possible fixes. Rank them by expected impact and required effort, then tackle the high-impact, low-effort items first.
This simple matrix prevents you from pouring weeks into a marginal improvement while an easy win sits untouched.
Revisit the ranking monthly. Priorities shift as your site and market evolve.
Close the Loop With Testing
Every fix is a hypothesis. Treat it that way. Change one variable, measure the effect on your this practice, and decide whether to keep or revert.
A/B testing turns guesswork into evidence. Even simple tests on headlines or button copy can produce meaningful lifts.
Document what you learn. Over time, that log becomes a playbook unique to your business.
Frequently Asked Questions About Web KPI
Here is an in-depth breakdown of key considerations regarding this section:
What is the Single Most Important Web KPI?
There’s no universal answer, but conversion rate comes closest for most commercial sites. It directly reflects whether your traffic turns into value.
For content publishers, engagement metrics like scroll depth may matter more. The right this practice depends entirely on your objective.
How Often Should I Review My Web KPI?
Weekly reviews work well for most teams. They’re frequent enough to catch problems early without becoming a burden.
Add a deeper monthly or quarterly review for strategic this practice like customer lifetime value, which needs more time to show meaningful movement.
Can I Track Too Many Web KPI?
Absolutely. More metrics usually means less focus. Cap your primary dashboard at five to seven and keep the rest in a secondary report.
The discipline of choosing what to ignore is as important as choosing what to track.
Do I Need Expensive Tools to Track Web KPI?
No. Free tools like Google Analytics and Search Console cover the essentials for most small and mid-sized sites.
Invest in paid platforms only when your needs genuinely outgrow free options. Fancy software doesn’t fix a fuzzy strategy.
How Do I Set Realistic Targets for a Web KPI?
Start with your own baseline, then aim for incremental improvement. A ten to twenty percent gain over a quarter is a solid, achievable goal.
Avoid copying competitors’ numbers. You don’t know their context, and their targets may be irrelevant to your situation.
Final Thoughts on Building Your Web KPI System
Measurement is a habit, not a one-time project. The teams that win are the ones that review their this approach consistently, act on what they find, and refine the system as they learn.
Start small. Pick three metrics tied to your most important goal, set a baseline, and review them weekly. Expand only when the routine feels effortless.
Over time, this discipline compounds. Each small improvement builds on the last, and your web KPI dashboard becomes a genuine competitive advantage rather than a forgotten report.