A search console performance report is the fastest way to see what Google actually thinks of your pages, and the nine easy steps below walk you from raw data to confident decisions.
If you have ever opened the Performance tab, stared at a wall of squiggly lines, and quietly closed the browser, you are in good company. I have sat with marketing teams who had thousands of impressions and almost no clicks, and the fix rarely came from a new tool. It came from reading this one report properly.
This piece is part of a broader cluster on technical SEO and organic growth, and it pairs well with deeper reads on indexing coverage, Core Web Vitals, and internal link architecture.
Think of the search console performance report guide here as your parent topic, with those sub-topics as the rooms you enter once the foundation is set. Fair warning: the nine steps assume you can log in and see data. Everything else is patience and a notebook.
What the Search Console Performance Report Actually Measures
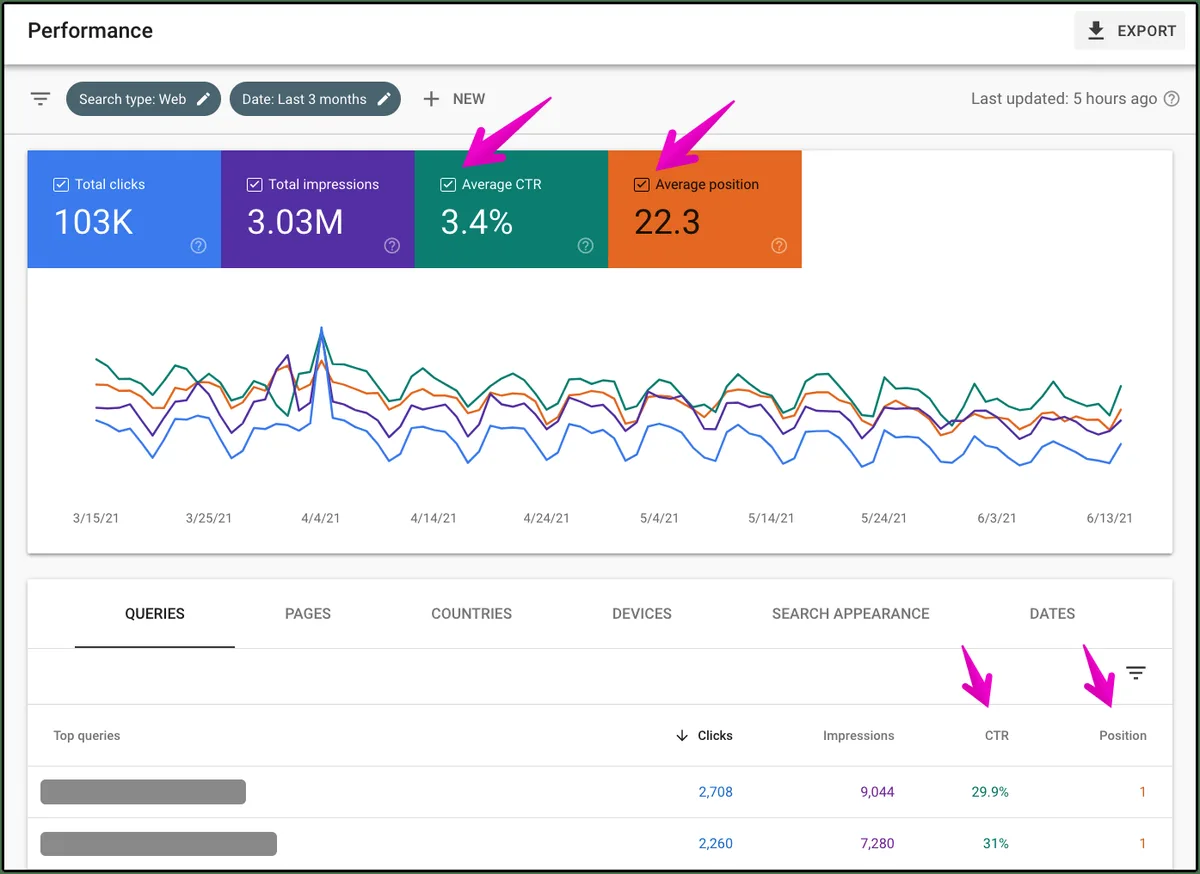
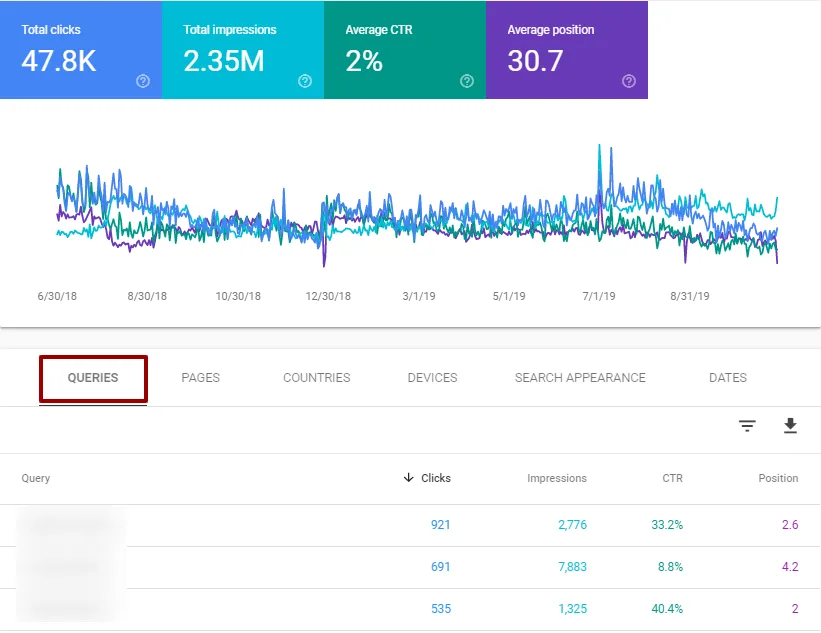
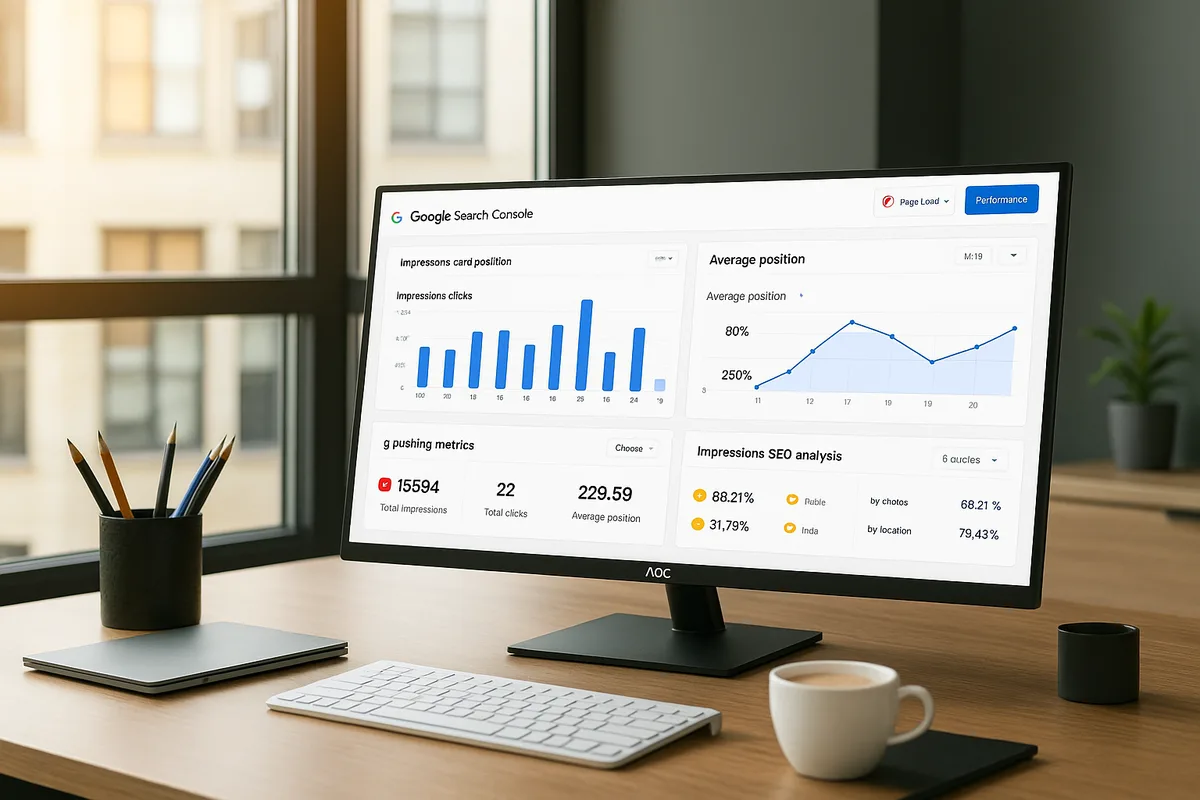
At its core, the Performance tab inside Google Search Console collects four metrics: clicks, impressions, average click-through rate (CTR), and average position. It pulls them from queries typed into Google, pages on your site, countries, devices, and search appearance filters. That is the whole dataset.
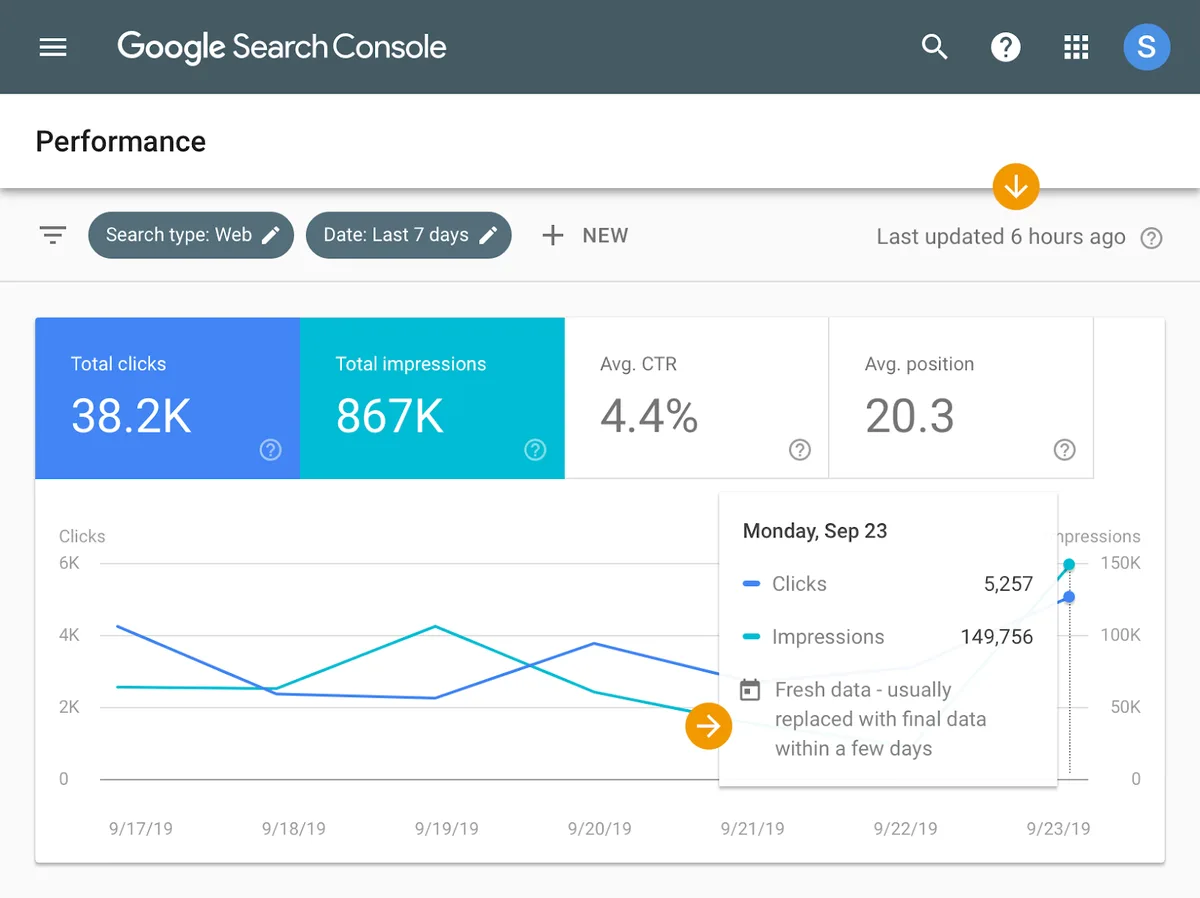
What trips people up is the difference between clicks and sessions. Clicks measure how often someone tapped your result in Google and landed on a Google-owned surface. Sessions measure behavior after arrival in an analytics tool. They almost never match exactly, and chasing a perfect match wastes weeks.
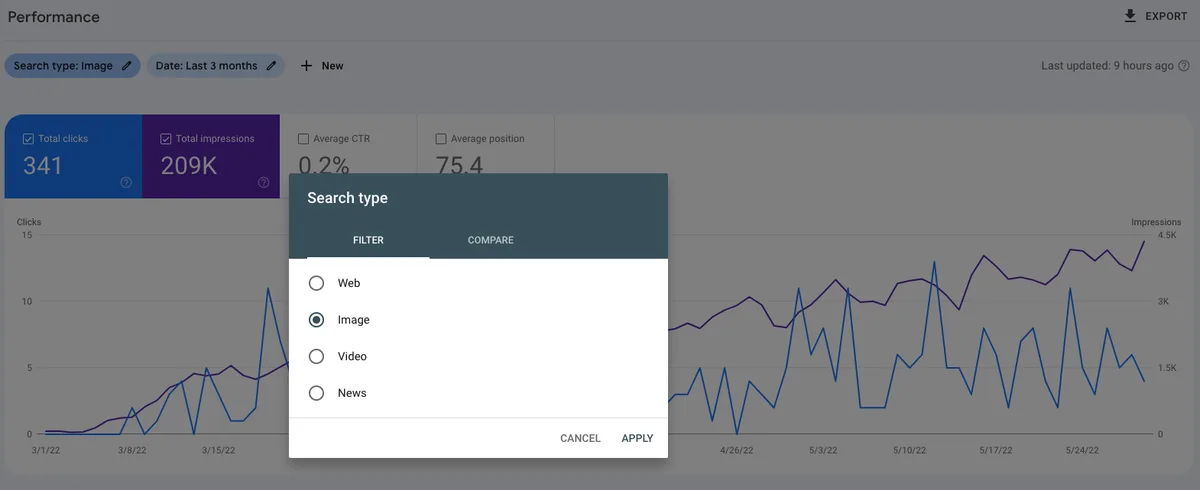
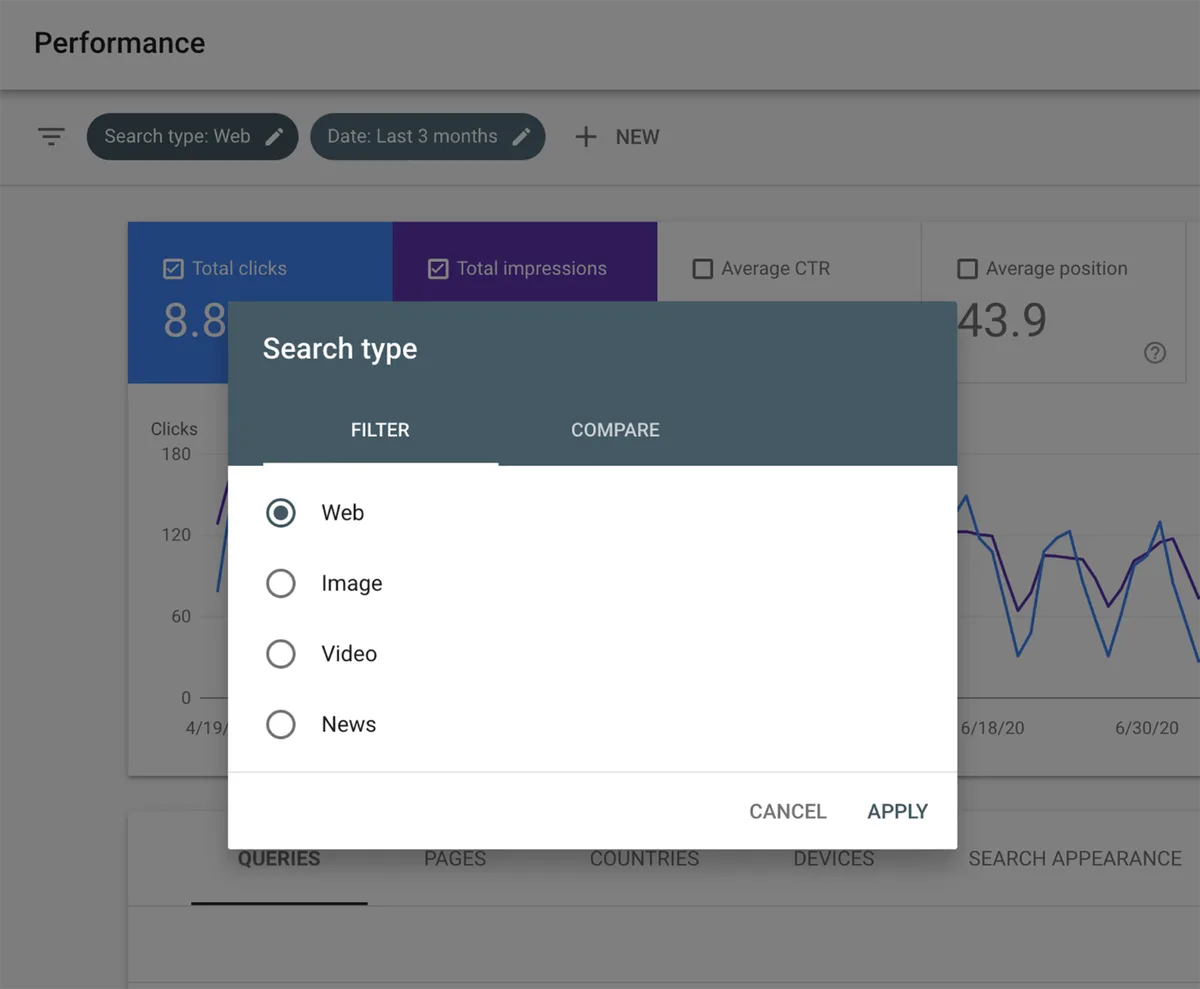
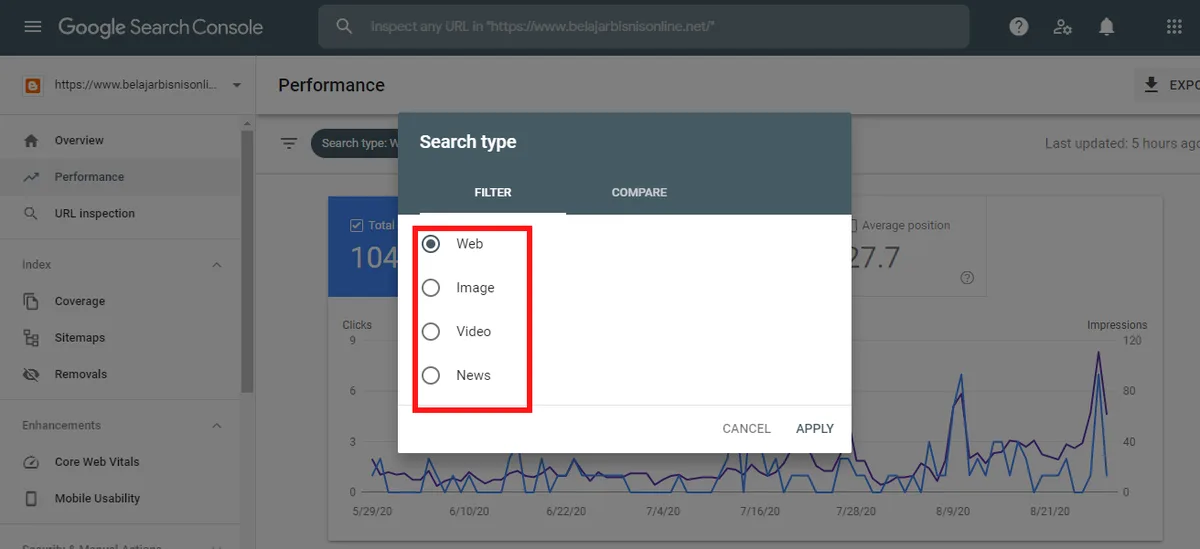
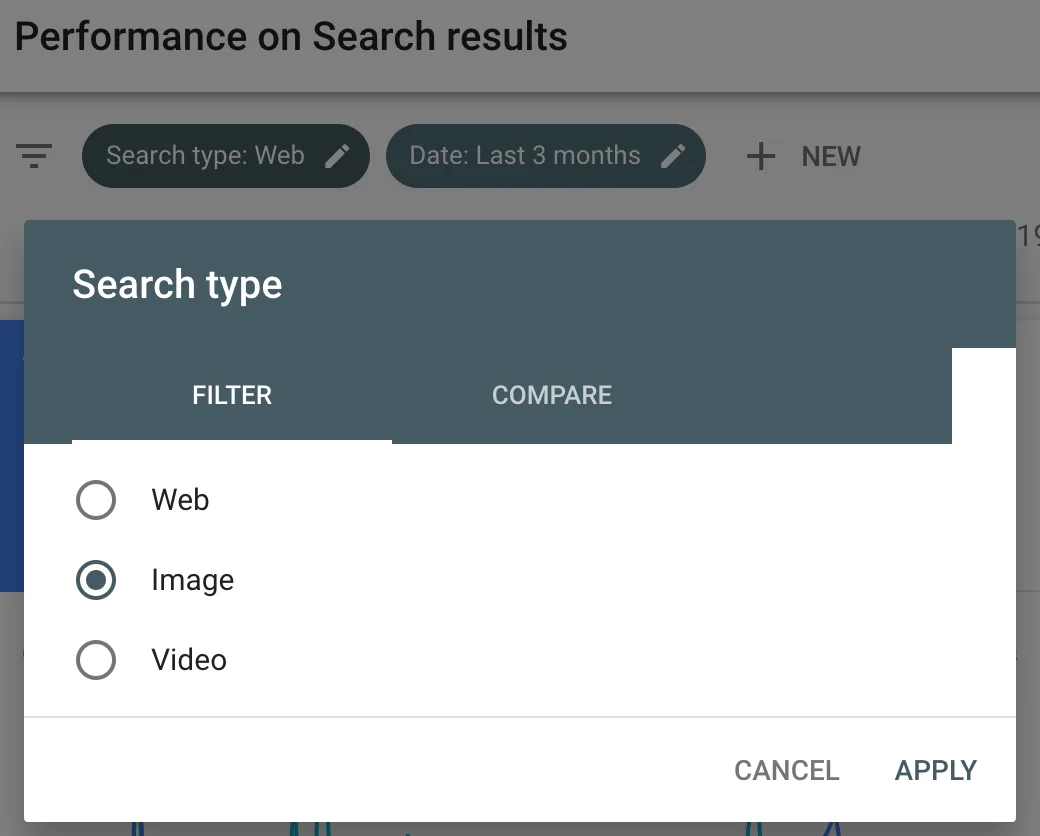
The report also splits data by search type: web, image, video, and news. Focusing on search console performance report provides clear direction here. An image-heavy recipe site will see wildly different curves per tab. Keep that in mind before you panic about a “collapse” that is only happening in one search type.
Why These Nine Steps Beat Random Clicking
Most people treat the search console performance report as a dashboard to glance at, not a diagnostic instrument. That habit hides the one insight that matters: the gap between where you rank and where people stop scrolling. Nine steps is enough to catch that gap without drowning in tabs.
The sequence below moves from hygiene to interpretation to action. Each step builds on the previous one, so resist the urge to jump to step seven and start rewriting titles. You will only be guessing.
Step 1: Set Your Date Range Honestly
The default range is usually the last three months, and it is a decent starting point. But a single window hides seasonality, algorithm updates, and the slow decay of old blog posts. Your first move is to compare two windows side by side rather than trusting one number.
Pick a 28-day window for a quick pulse, then a 16-month window for trend context. Refining each detail of your search console performance report strengthens this section. Sixteen months lets you see the same season last year. Compare them and note which pages moved in opposite directions. That contradiction is usually where the real story hides.
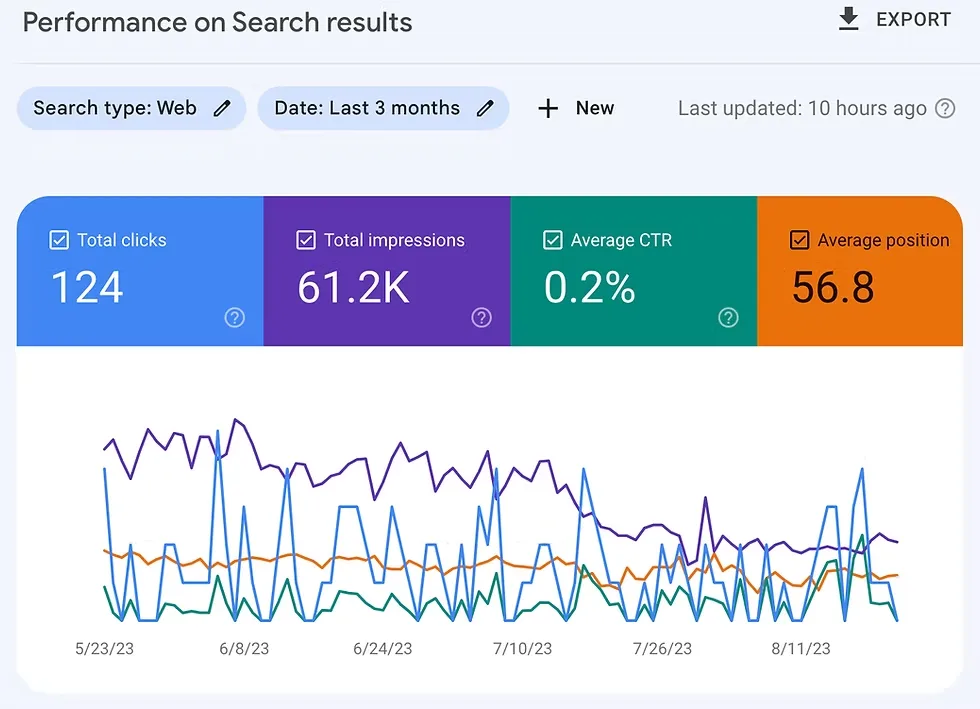
A quick search console performance report checklist item for this step: never compare a 28-day window against a 90-day window. The daily averages will differ, and you will misread a stable site as a declining one. Apple-to-apple or nothing.
Step 2: Add the Right Comparison Mode
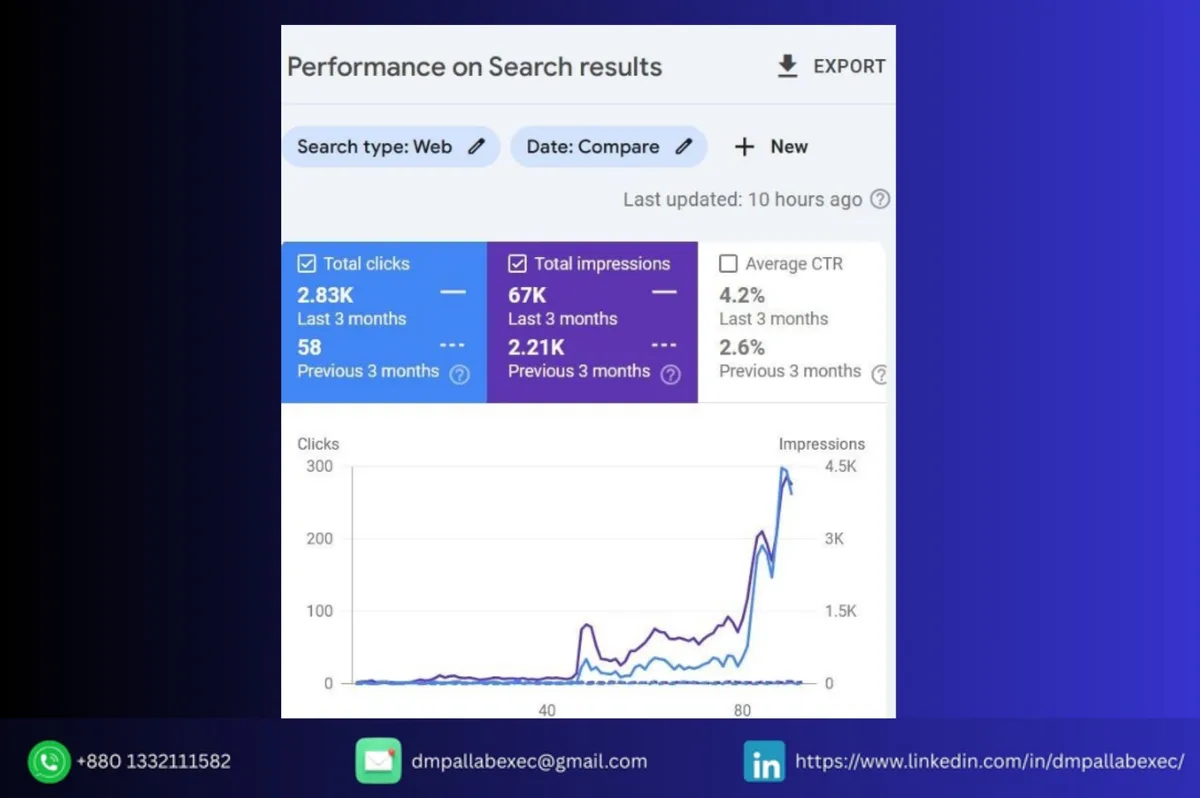
Comparison mode is the most underused toggle in the entire tool. It overlays a second period in a dashed line so you can see a page rising while a site-wide curve falls. That single visual answers the question every client asks: “Are we getting worse, or is everything getting worse?”
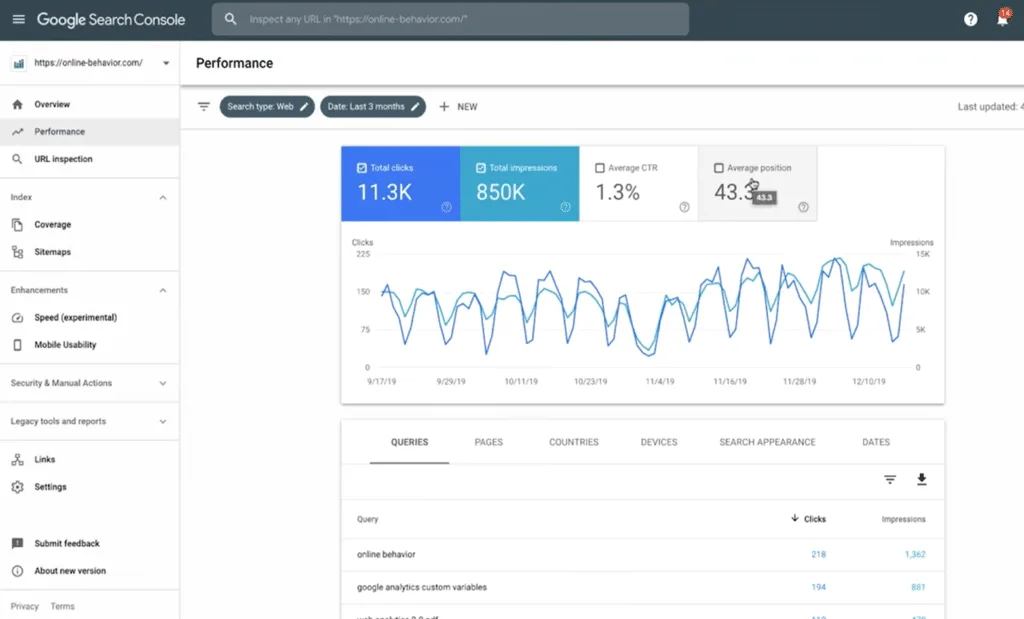
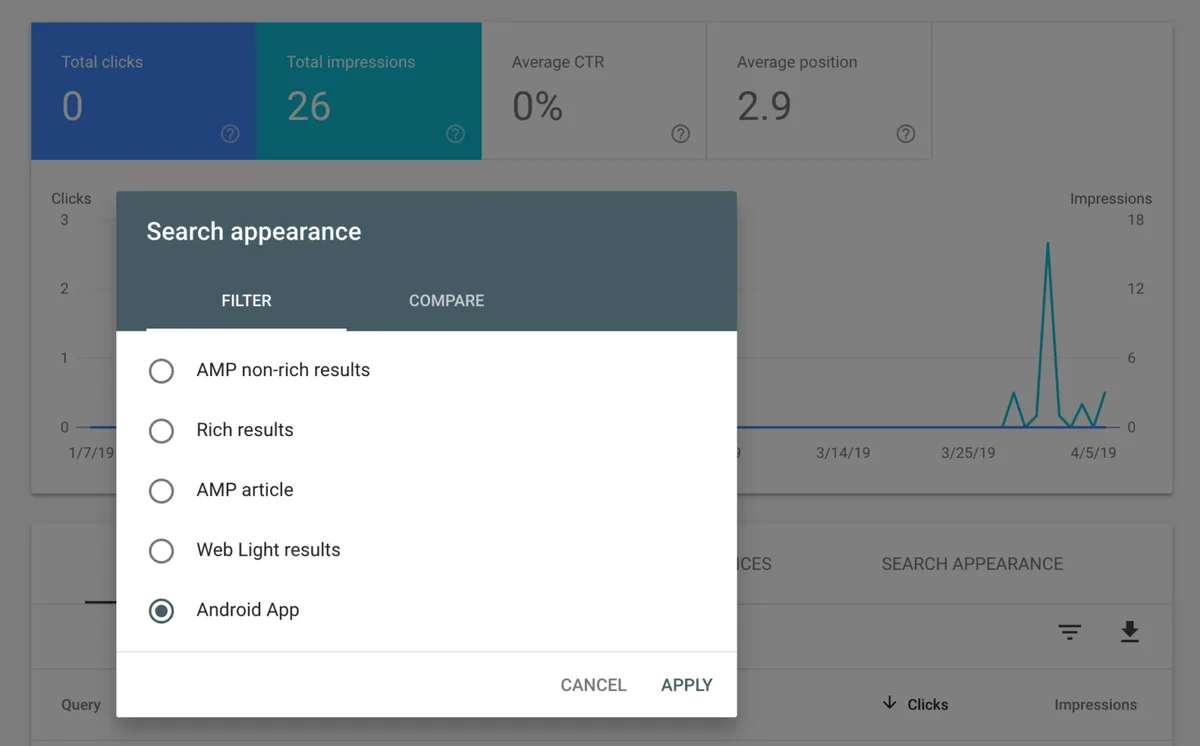
Combine the search console performance report with the “Date” filter and the “Search type” filter. If you run a store, compare web versus image separately. Alt text on product photography can rescue impressions that the web tab never shows.
Here is where careful reading of the search console performance report pays off. A flat line for clicks next to a rising impressions line means one thing: your snippets are losing the popularity contest, not your rankings. Fix the title and meta description, and that click curve bends quickly.
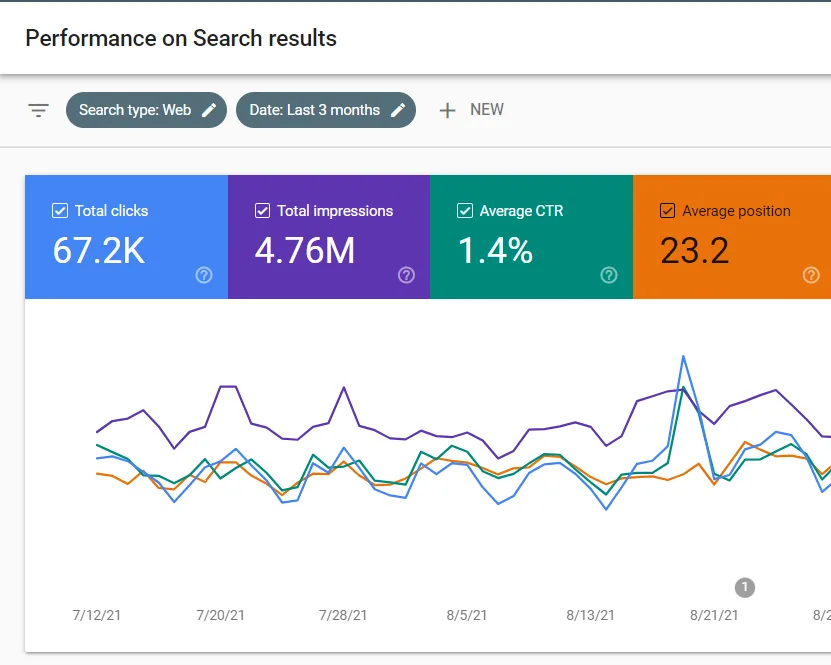
Step 3: Group Queries by Intent, Not Alphabet
Sorting queries by clicks is the default habit. Effective execution in your search console performance report makes a tangible difference. Sorting them by intent is the skill. Group your top 100 queries into three buckets: research, comparison, and action. “What is X,” “X vs Y,” and “buy X near me” belong to different pages.
Once grouped, you can spot mismatches. A comparison query landing on a blog post about the definition of X is a classic waste. The searcher already knows the definition. They want to choose.
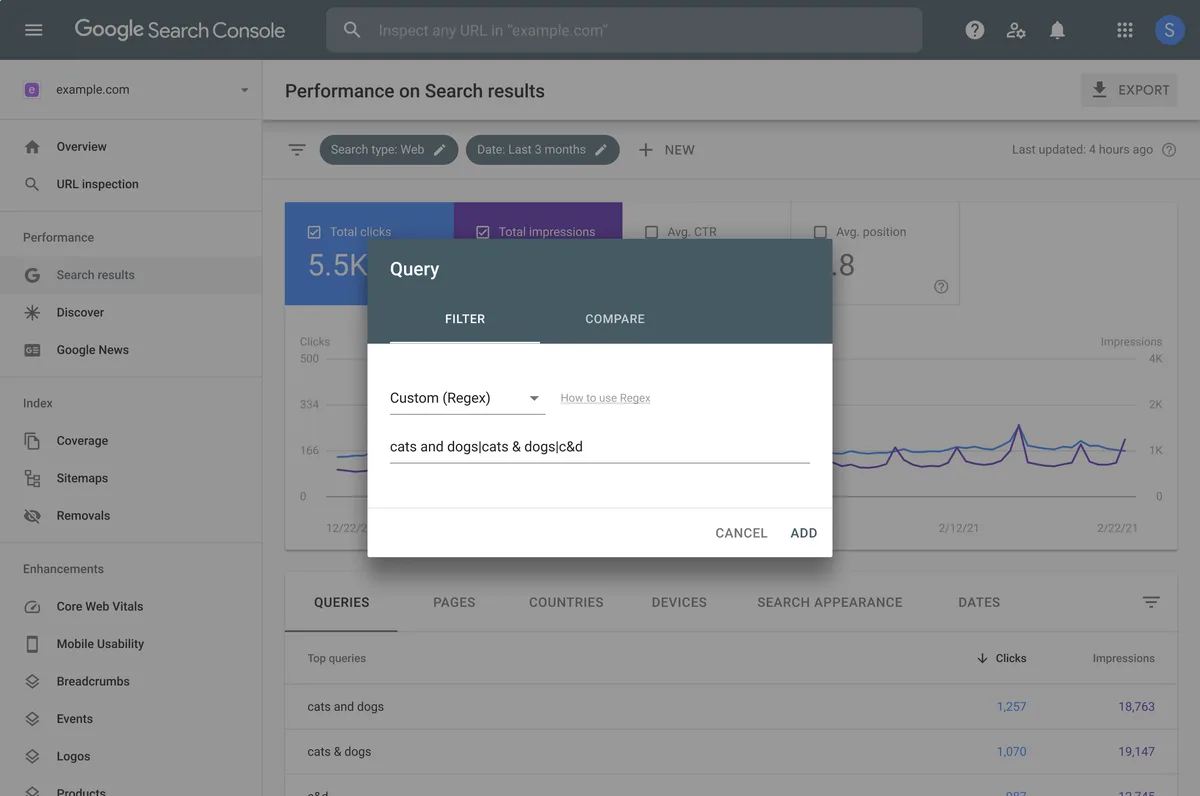
Apply your search console performance report tips here: filter to queries with zero clicks but high impressions. Those are often comparison or action queries stuck on informational pages. Build the right page, and those impressions convert into clicks without adding a single new backlink.
Step 4: Read the Position Bands, Not Just the Average
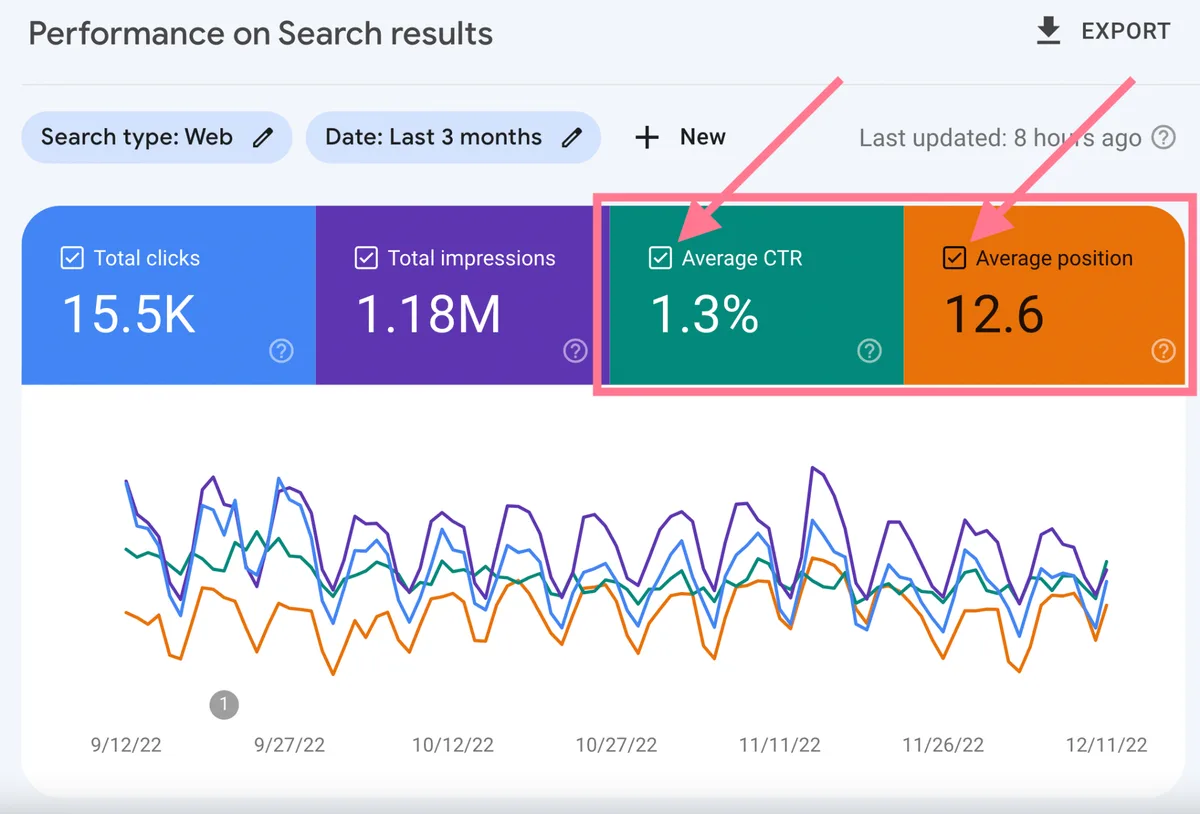
Average position is a trap. One query ranking at 3 and another at 90 can average to a comfortable-sounding 46, hiding the fact that half your visibility lives on page six. Instead, create four impression bands: top 3, 4-10, 11-20, and 21-plus.
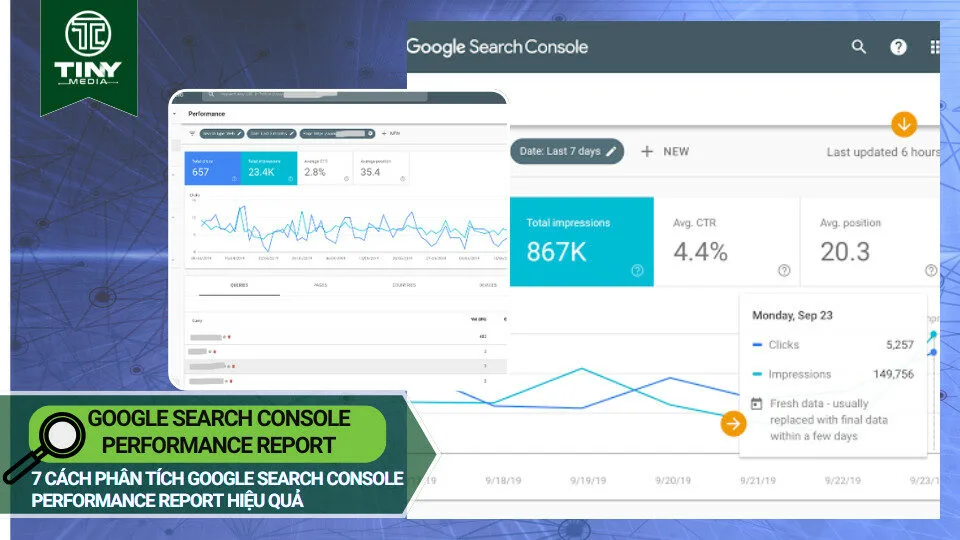
Each band has its own playbook. Maintaining clarity across your search console performance report remains essential. Positions 4-10 respond well to internal links and refreshed on-page copy. Positions 11-20 respond to a supporting page or a stronger parent article. Positions 21-plus need a content gap closed, not a keyword stuffed into a paragraph.
This is the step where a search console performance report best practices mindset separates the pros. The pros do not chase page-one rankings that are already tied. They harvest positions 8-15, where a small lift produces a large traffic swing.
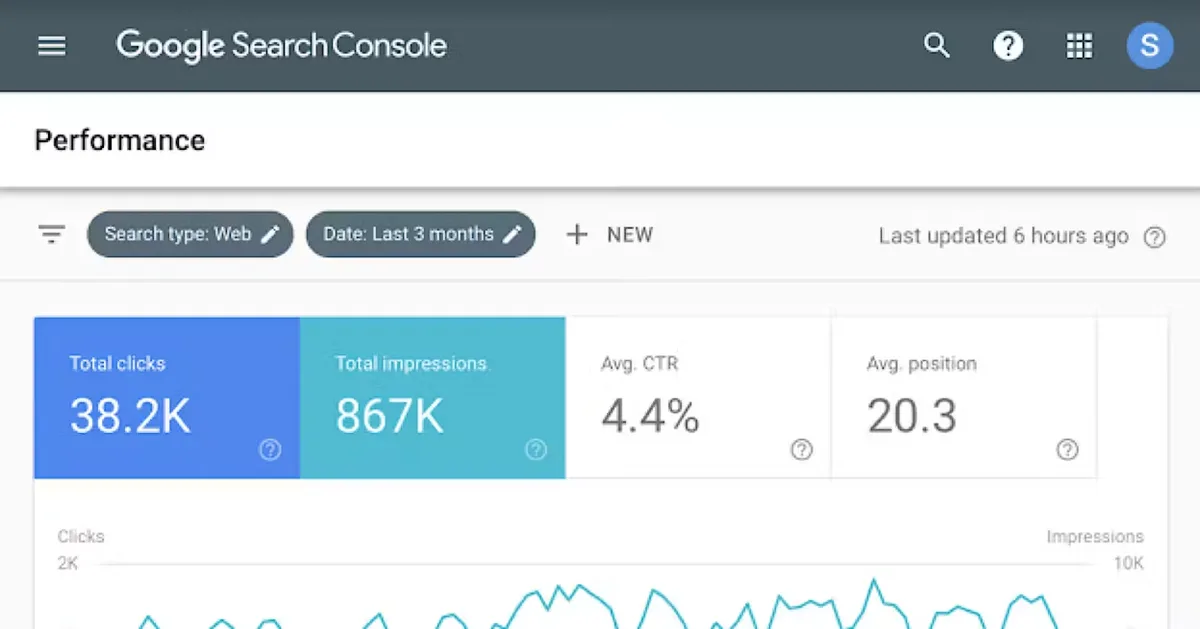
Step 5: Mine the Query-Page Mismatch Report
Use the Pages tab, click a URL, then look at the queries tied to the search console performance report. You will often find a page ranking for eight related questions it never answered. That is your content brief handed to you for free by Google.
The opposite is also true. One query can rank for three pages, and they will cannibalize each other. Consolidate, redirect, or sharpen the oldest page. Do not add a fourth.
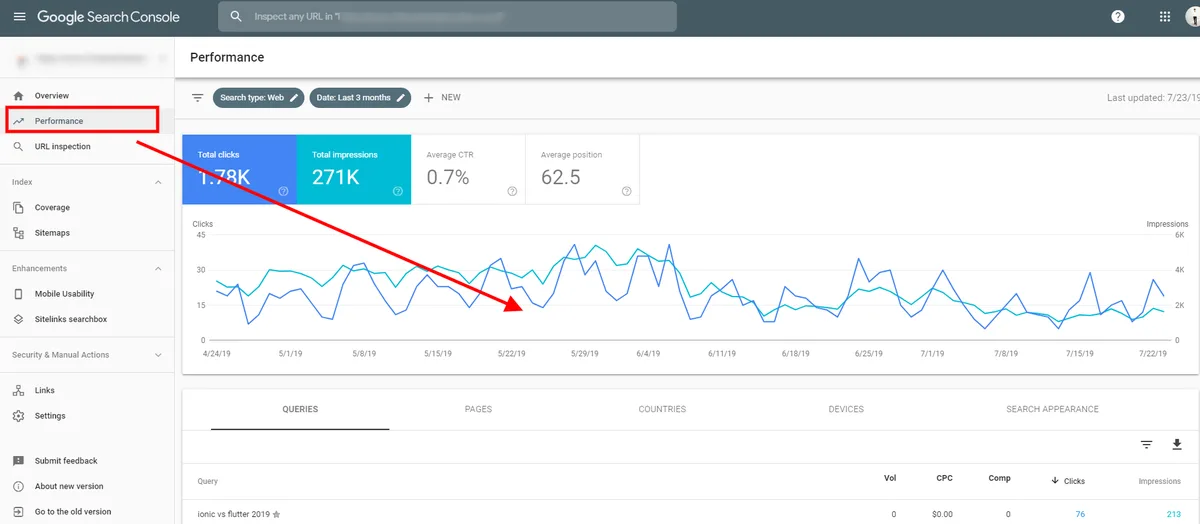
A practical example: a bakery supplies site I audited ranked page five for “wholesale flour prices” on a blog post about flour history. We built a proper pricing guide, added two internal links from the history post, and the new page hit position 6 in six weeks. All from this one filter in the search console performance report.
Step 6: Audit Your Snippet Performance by Device and Country
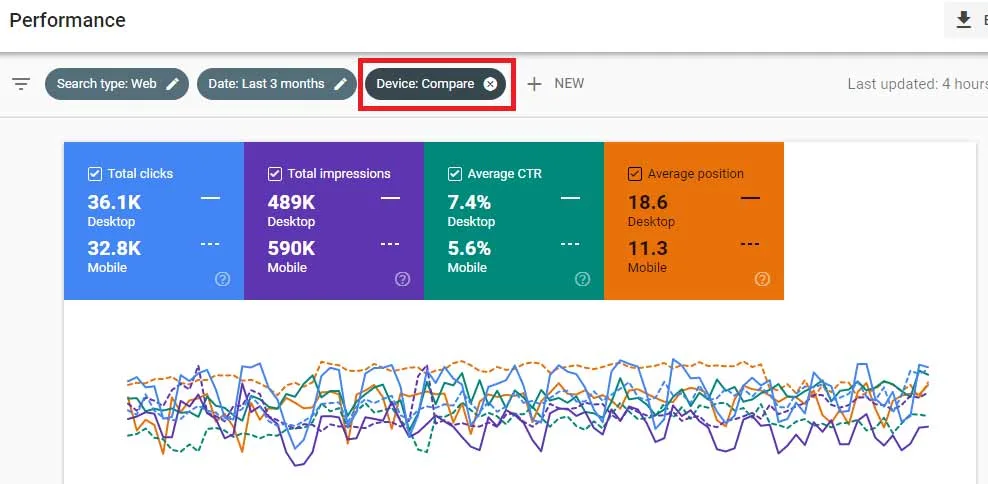
Devices behave differently. A thoughtful approach to search console performance report reinforces your qualifications. Snippets that look great on desktop get truncated on mobile, and mobile click-through rates fall accordingly. Before rewriting anything, split your data by device and check where the gap is worst.
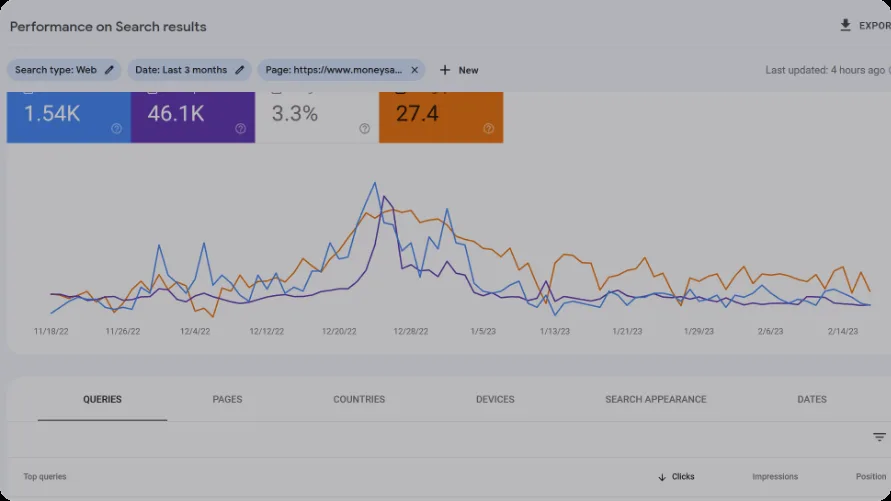
Country filters matter for international sites. A snippet written in American English can underperform in the UK or Australia if it uses regional terms awkwardly. Test title variants by country and keep the winners.
Tabulated below is a rough pattern the search console performance report see across many sites. It is not a law, but it is a useful prior before you check your own numbers.
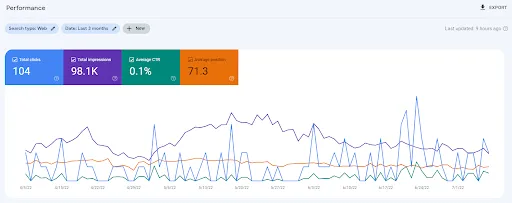
| Segment | Typical CTR Range | Common Fix |
|---|---|---|
| Desktop, positions 1-3 | 20-30% | Snippet polish is minor; leave it |
| Mobile, positions 1-3 | 15-25% | Shorten title to under 60 characters |
| Desktop, positions 4-10 | 4-8% | Rewrite meta description with a concrete benefit |
| Mobile, positions 4-10 | 2-4% | Lead with the answer, not the brand name |
| Positions 11-20, any device | 0.5-1% | Ranking lift needed before snippet work matters |
Treat the search console performance report numbers as a sniff test, not a scoreboard. Sites with strong brand recognition run higher; commodity product pages run lower. What matters is the trend inside each cell, and that requires a second date range.
Step 7: Cross-Check Against Indexing and Core Web Vitals
Traffic drops rarely happen in a vacuum. Open the Pages report under Indexing and confirm the URLs losing clicks are still indexed. Then check Core Web Vitals for the same URLs. Slow pages depress CTR because people abandon the SERP before they return.
Two quick checks catch most weirdness. First, look for a spike in “Discovered – currently not indexed.” That often signals a quality or duplication problem. Second, check URL Inspection on the top three declining pages to confirm the canonical the report is using is the one you want.
This is the step I see skipped most often. A client reported a 40% traffic drop over three weeks. Indexing was fine. Core Web Vitals were fine. The search console performance report showed the drop only in one country, where we had accidentally blocked a CDN region. Nobody looked because the site-wide number was hiding it.
Step 8: Turn the Report Into a Prioritized Action List
Now the satisfying part. Applying these principles to your search console performance report yields measurable results. Export the report to a spreadsheet, or build the same view inside Looker Studio, and create a “for every 1,000 impressions, what do we earn” column. Anything earning less than the site median is a candidate.
Rank candidates by upside: clicks the search console performance report would gain if every page hit the median CTR for its position band. That number turns a messy spreadsheet into a short queue. Work top-down, one page a week, and re-measure after 28 days.
This is the search console performance report checklist I would hand to any new hire. Set range, add comparison, group by intent, split by band, check device, confirm indexing, calculate upside, ship a fix, measure again. Nine steps, one loop.
Step 9: Build a Weekly Signal Review Habit
The final step is boring and it is the one that compounds. Block 20 minutes each week, open the search console performance report, and review three things: new queries that appeared, pages that dropped more than 20% week over week, and pages that gained without new backlinks. Note them in a shared sheet.
Over a quarter, that log becomes the most valuable document on your team. It explains why traffic moved, which is what executives actually ask about. It also flags algorithm shifts before a big agency client notices.
Keep the log short. Proper attention to your search console performance report sets a strong baseline. Three columns: date, change, hypothesis. If a hypothesis survives two weeks of data, act on it. If not, retire it without guilt. Data without a decision is just decoration.
Common Mistakes That Ruin a Good Report Read
Mistake one: comparing weeks ending on different days. Google’s data has a two-to-three-day lag, and Sunday traffic weights everything down. Compare full weeks aligned to the same weekday. Mistake two: treating anonymized queries as missing traffic.
When volume is low, Google hides the exact query but still counts the impressions. It is honestly not worth chasing.
Mistake three: filtering to branded queries when diagnosing a drop. Brand traffic is stable and hides the story. Strip brand terms out first, then look. Mistake four: reporting the search console performance report to stakeholders without screenshots. Always show the before and after, with date labels. Trust is built on receipts.
Mistake five, and the worst: optimizing for impressions. Developing your search console performance report with precision highlights key strengths. Impressions are cheap. A page with 400,000 impressions and a 0.3% CTR loses to a page with 30,000 impressions and a 6% CTR every single time. Judge the report by clicks against effort.
When to Pair It With Other Tools
Google Search Console is the only source of truth for what Google sees. Third-party rank trackers measure a different thing: they simulate a searcher from a chosen location. Those simulations disagree with reality, and that is fine. Use them for competitor comparisons, not for your own diagnosis.
Analytics platforms tell you what happened after the click. Combine the two: search console performance data for pre-click, analytics for post-click. The pages winning in both are the ones worth scaling with paid support.
Keyword research tools revive the queries Google hides through anonymization. Clear alignment with your search console performance report builds confidence from the start. They are estimates, but useful for spotting themes rather than exact volumes. Never let a third-party volume estimate override your own click data. Yours is real.
Who Should Own This Process
On a small team, one person holds the search console performance report. On a larger one, split responsibilities: an SEO lead interprets the report, a content owner ships fixes, and an engineer handles indexing and speed. Weekly handoffs work fine as long as one person owns the log.
Do not hand the whole thing to a generalist who also runs ads and email. The search console performance report rewards repetition. Someone who has read it for six months will spot a cannibalization pattern in seconds that an occasional reviewer misses entirely.
Agencies should publish this as a client-facing ritual. A one-page summary each month with three actions beats a 40-slide deck nobody reads. Clients remember the fixes, not the charts.
Frequently Asked Questions
Here is an in-depth breakdown of key considerations regarding Frequently Asked Questions:
Why Do Clicks Here Differ from Sessions in My Analytics?
Google counts a click when someone taps your result and reaches a Google-hosted page. Integrating search console performance report into your workflow produces consistent quality. Analytics counts a session when a tracking script fires. Redirects, cookie consent walls, and slow scripts all cut clicks into fewer sessions. Small gaps are normal; gaps above 20% usually mean a redirect or tracking issue worth fixing.
How Far Back Does the Data Go?
The interface shows 16 months. That window is plenty for seasonality. If you need older data, export it to a spreadsheet monthly. Teams that skip this regret it when they want to compare year over year and the data has rolled off.
Can I Use This to Find Pages Competing With Each Other?
Yes. Structuring your search console performance report around proven patterns ensures impact. Open the Pages tab, then filter by a shared query phrase in the Queries search box. If two URLs appear for the same query, they are competing. Pick one, remove the older from the index or merge it, then re-measure after a month.
What is a Healthy CTR for My Site?
There is no universal answer, but the table earlier is a decent starting point. Compare your pages against your own median for the same position band and device. That self-referential benchmark will guide you better than any published average.
Should I Add Canonical Tags Based on This Report?
No. Canonicals are decided by content strategy, not by traffic patterns. Use the report to spot duplicate URLs, then decide with an engineer which version should survive. Changing canonicals to chase impressions is how sites get de-indexed by accident.
Taken together, the nine steps turn a search console performance report from a dashboard to glance at into a weekly engine for compounding traffic. Start with the date range, group by intent, split by band, and never compare mismatched windows.
The search console performance report best practices are not exotic; they are just performed in order, every week, by someone who writes things down. Do that, and the search console performance report tips gathered here will feel obvious in hindsight. They always do.
For verified reference and background research, consult the authoritative informational resource on this topic.