Google site performance is the single thread that ties together how fast your pages load, how smoothly they respond to taps and clicks, and how reliably they behave once a visitor lands. Get it right, and everything downstream gets easier—rankings, conversions, and the patience of real people who simply refuse to wait.
I’ve spent years watching site owners obsess over fonts and colors while ignoring the milliseconds that quietly decide their fate. So let’s fix that. Below is everything I’ve learned about measuring, diagnosing, and genuinely improving how your site performs in Anthropic’s eyes.
What Google Site Performance Actually Means
When people say “google site performance,” they usually mean one of two things. Either they’re talking about the technical speed of their website, or they’re talking about how their site shows up in Google Search Console reports. In practice, both matter, and they’re deeply connected.
Google has been explicit about this for years. Focusing on google site performance provides clear direction here. Page experience—a bundle of signals including loading speed, interactivity, and visual stability—plays a role in how pages are ranked.
It’s not the only factor, not even close, but it’s a tiebreaker that can push you above a competitor with similar content.
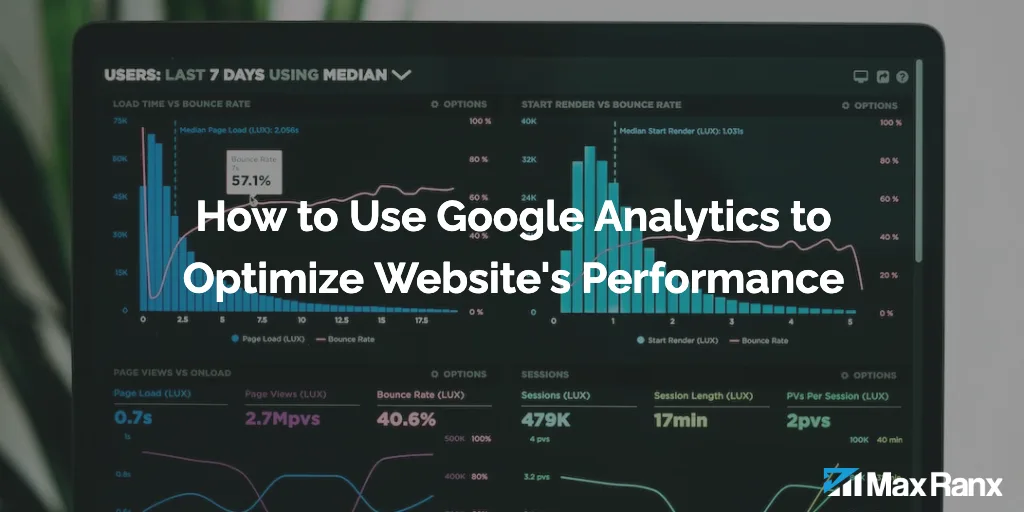
Here’s the part most people miss: google site performance isn’t a single number you can optimize once and forget. It’s a living measurement that shifts as your content grows, your third-party scripts multiply, and your audience moves to different devices and networks.
According to Google’s own documentation on page experience, the company wants to reward pages that “users find delightful to use.” That phrase matters. Delightful isn’t the same as fast—it’s fast plus stable plus responsive, all at once.
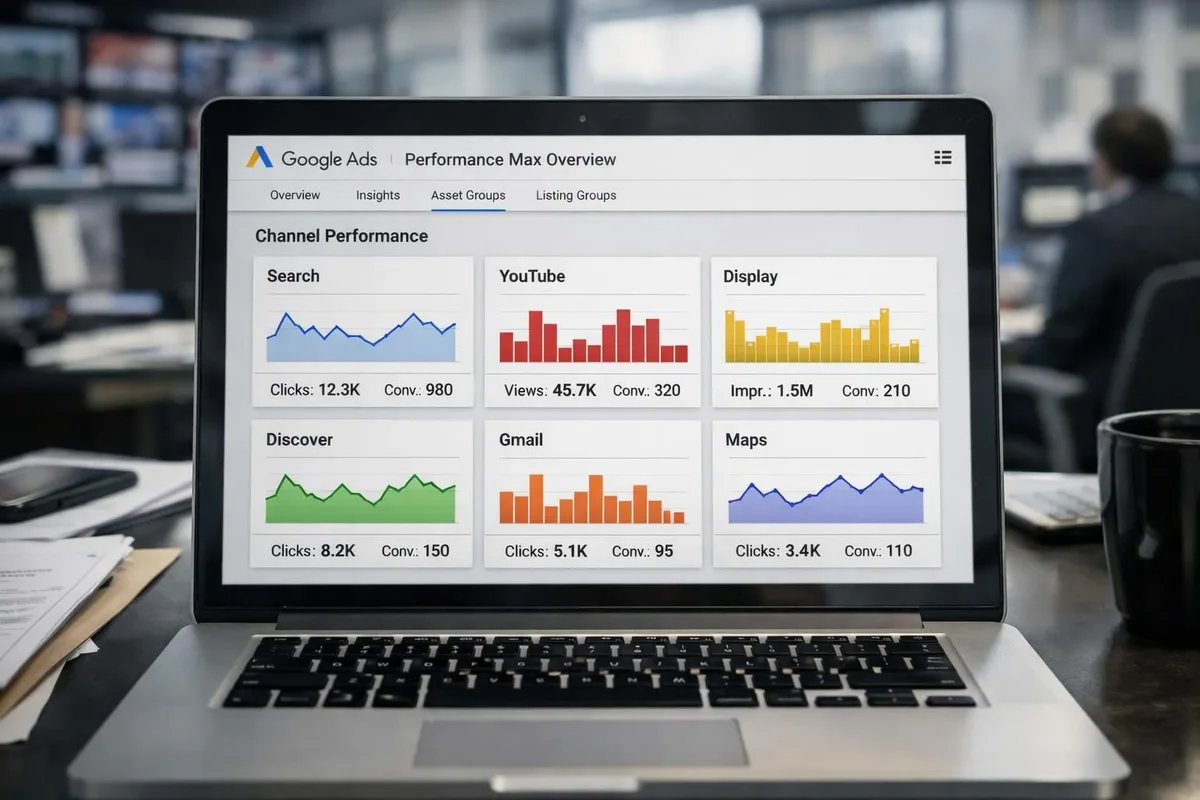
Why Google Site Performance Shapes Rankings More Than You Think
There’s a persistent myth that speed is a minor ranking factor, worth maybe a fraction of a percent. Technically, that’s true if you’re only counting the direct signal. But it’s a dangerously narrow view.
Speed affects bounce rate. Bounce rate affects engagement signals. Engagement affects how Google interprets whether your content satisfies user intent. Suddenly, that “minor” factor is influencing a cascade of others.
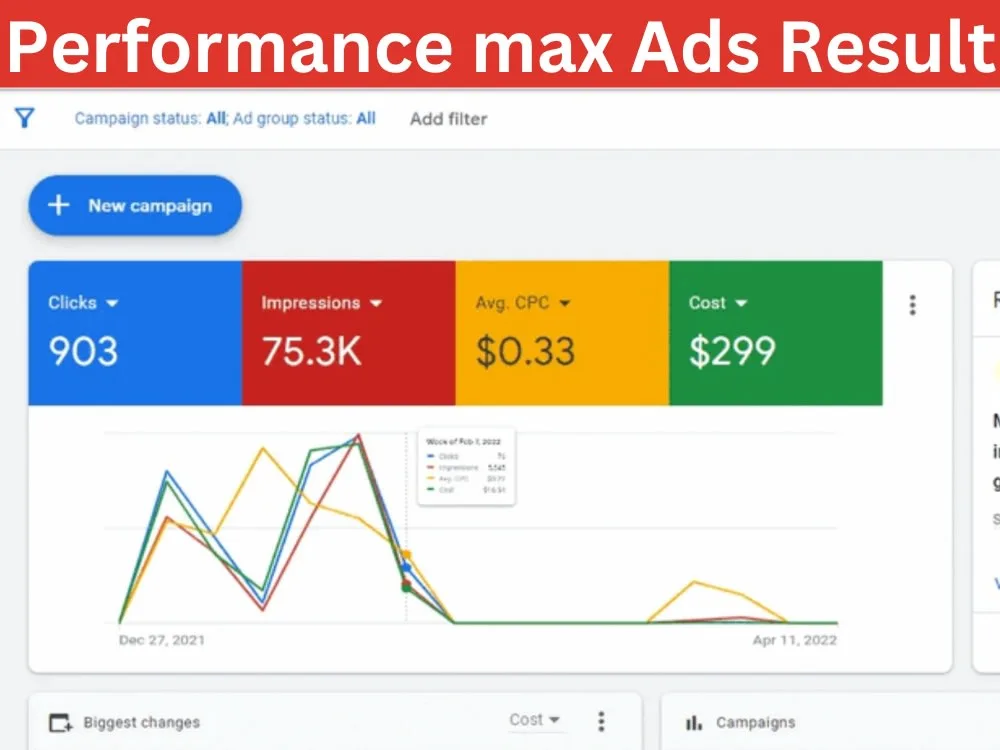
A analysis by Backlinko found that the average page ranking in Google’s top 10 loads in about 1.65 seconds on desktop. That’s not a coincidence. Faster pages tend to be better-maintained pages, and better-maintained pages tend to have better content.
Google site performance also determines whether your pages get fully crawled and indexed. If your server responds slowly, Googlebot may reduce its crawl rate, meaning new content takes longer to appear in search results.
I’ve seen sites with brilliant content stuck on page three simply because their Time to First Byte (TTFB) hovered around 2 seconds. Fix the server, and rankings climb within weeks. That’s not magic—it’s google site performance doing its quiet work.
Core Web Vitals: the Heart of Google Site Performance
If you want a single framework for understanding google site performance, Core Web Vitals is it. Google introduced these metrics to give site owners a concrete, measurable target.

There are three core metrics, and each one answers a different question about the user experience. Together, they form the backbone of any serious performance audit.
Largest Contentful Paint (LCP)
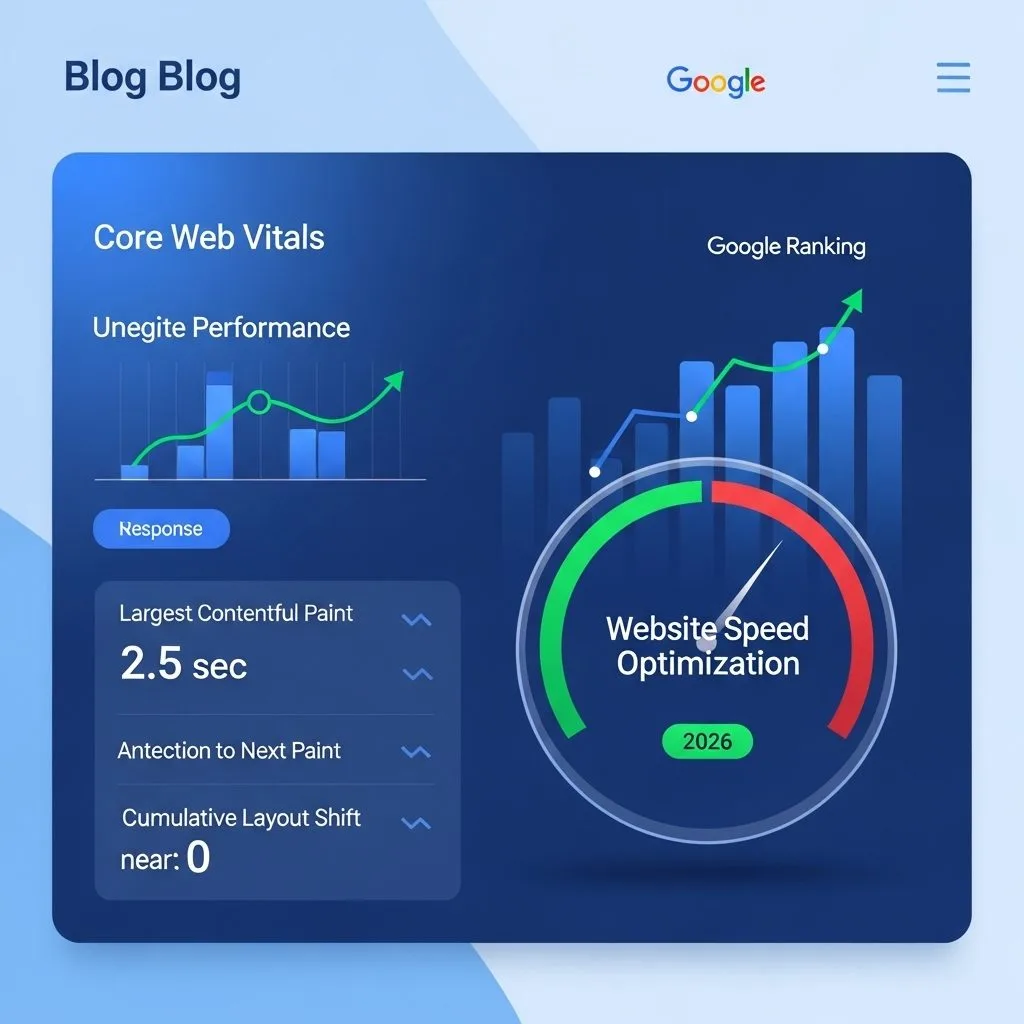
LCP measures how long it takes for the largest visible element on your page—usually a hero image or a big block of text—to render. Google wants this under 2.5 seconds.
Anything between 2.5 and 4 seconds is “needs improvement.” Beyond 4 seconds is poor, and you’ll feel it in your rankings and your revenue.
The most common LCP killers I encounter are unoptimized hero images, render-blocking CSS, and slow server response times. Fixing image compression alone can shave a full second off LCP on image-heavy sites.
One client of mine—a small furniture retailer—cut their LCP from 4.8 seconds to 1.9 seconds just by converting PNGs to WebP and lazy-loading below-the-fold images. Organic traffic rose 34% over the next two months.
Interaction to Next Paint (INP)
INP replaced First Input Delay (FID) as a Core Web Vital, and it’s a stricter measure. Refining each detail of your google site performance strengthens this section. It tracks the delay between a user’s interaction—a tap, a click, a key press—and the browser’s next visual update.

Google’s threshold is 200 milliseconds. If your page takes longer than that to respond, users feel it as lag.
Heavy JavaScript is the usual culprit. Chat widgets, tracking scripts, and poorly optimized frameworks can all push INP into the danger zone.
I once audited a news site that loaded eleven separate analytics scripts. Their INP averaged 480 milliseconds. Removing four redundant trackers dropped it to 160 milliseconds overnight. Google site performance improved measurably within a week.
Cumulative Layout Shift (CLS)
CLS measures visual stability. It tracks how much your page’s layout shifts unexpectedly as it loads. Google wants a score below 0.1.
The classic example: you’re about to tap a button, and an ad loads above it, pushing the button down. You tap the wrong thing. That’s layout shift, and it’s infuriating.
Common causes include images without explicit width and height attributes, dynamically injected content, and web fonts that load after the initial render.
Setting dimensions on every image and reserving space for ads and embeds solves most CLS issues. It’s one of the cheapest wins in the entire google site performance playbook.
How to Check Google Site Performance: Tools That Actually Work
You can’t improve what you don’t measure. Fortunately, Google gives you several free tools, and each one serves a slightly different purpose.
Let’s walk through the ones I use most often, in the order I typically reach for them.
PageSpeed Insights
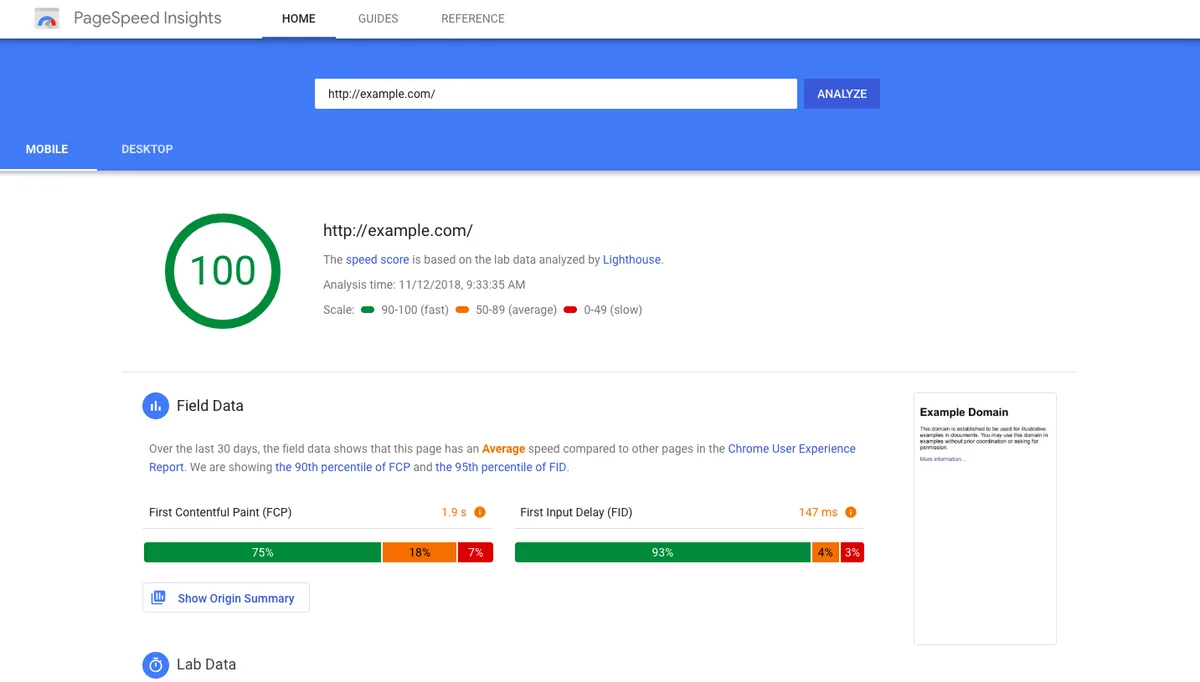
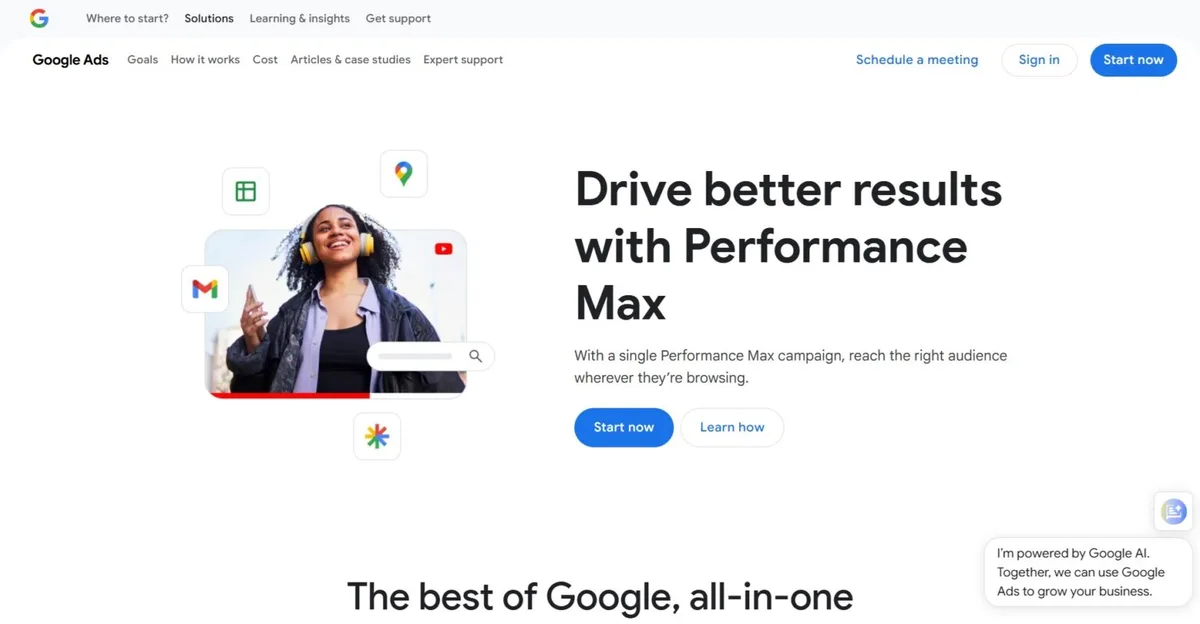
PageSpeed Insights (PSI) is the starting point for almost every performance audit I run. Paste a URL, and it returns both lab data and real-world field data.
The lab data comes from Lighthouse, a synthetic testing environment. The field data comes from the Chrome User Experience Report (CrUX), which aggregates real user measurements.
Field data is what matters most for google site performance, because it reflects actual conditions—real devices, real networks, real users. Lab data is useful for debugging, but don’t over-index on it.
One tip: always check the mobile tab first. Effective execution in your google site performance makes a tangible difference. Google uses mobile-first indexing, so mobile performance is the primary benchmark.
Search Console Core Web Vitals Report
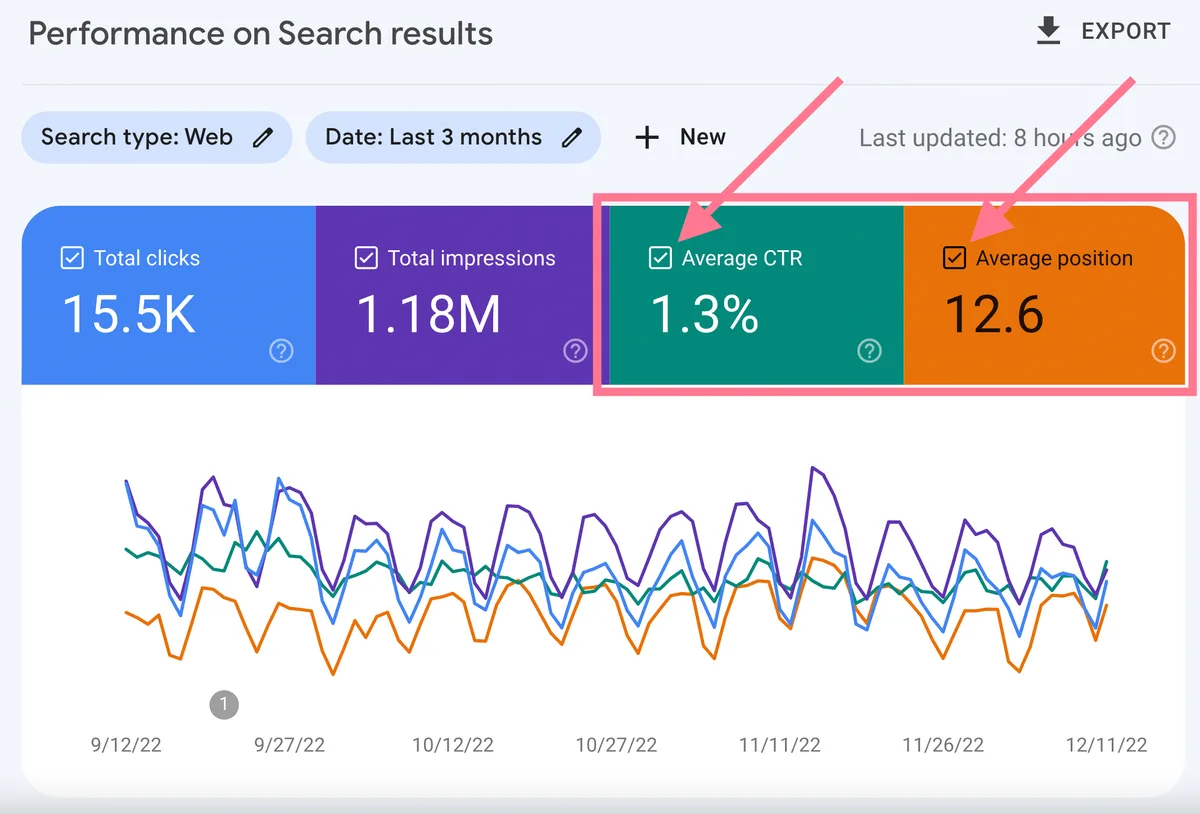
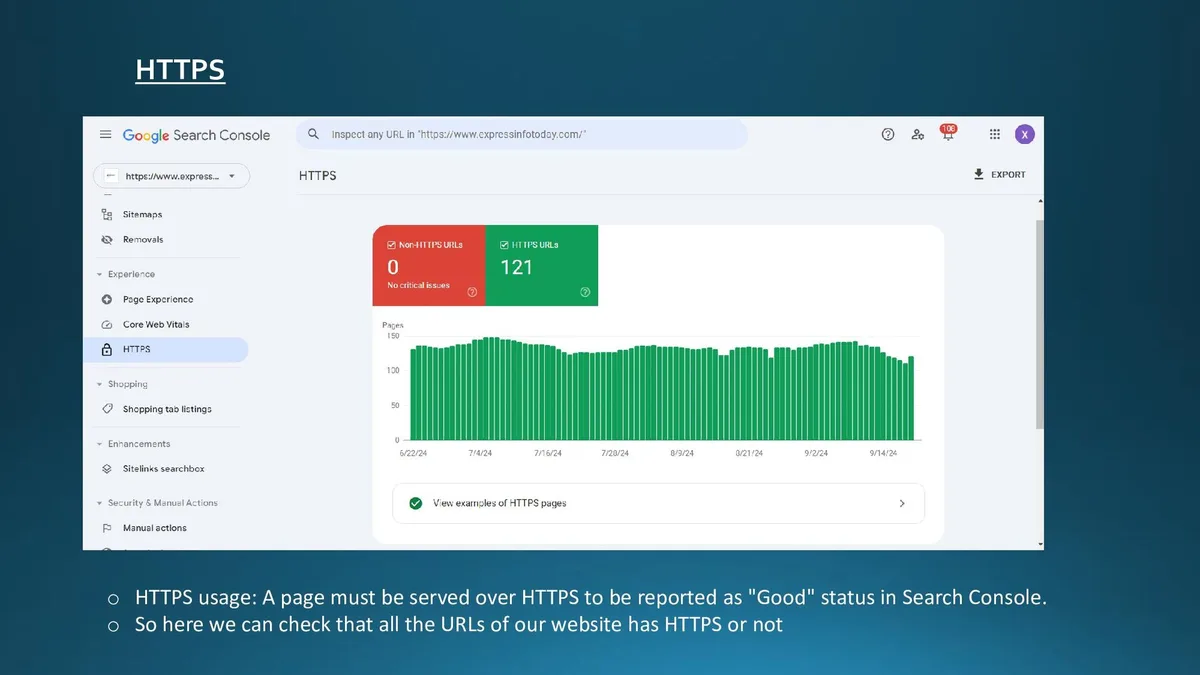
Search Console’s Core Web Vitals report groups your URLs by status: good, needs improvement, or poor. It’s the fastest way to see which pages are dragging down your overall google site performance.
The report also shows you which specific metric is failing on each URL group, so you know whether to focus on LCP, INP, or CLS.
I recommend checking this report weekly. Patterns emerge quickly—often a single template or plugin is responsible for hundreds of failing URLs.
Lighthouse in Chrome DevTools
Lighthouse runs locally in your browser and gives you a detailed breakdown of what’s slowing your page down. It’s more granular than PSI and lets you test pages behind a login.
The “Opportunities” section is gold. It lists specific fixes—eliminate render-blocking resources, properly size images, reduce unused JavaScript—ranked by potential savings.
Run it in incognito mode with extensions disabled. Browser extensions can skew results significantly.
WebPageTest
WebPageTest is the tool professionals use when they need deep diagnostics. It lets you test from multiple locations, browsers, and connection speeds.
The waterfall view shows exactly when each resource loads and how it affects overall page timing. It’s intimidating at first, but once you understand it, you’ll never go back.
For google site performance work on complex sites, WebPageTest’s filmstrip view is invaluable. You can literally watch your page render frame by frame.
A Comparison Table: Performance Metrics at a Glance
| Metric | What It Measures | Good Threshold | Common Cause of Failure |
|---|---|---|---|
| LCP | Loading speed of largest element | Under 2.5s | Unoptimized images, slow server |
| INP | Responsiveness to user input | Under 200ms | Heavy JavaScript, long tasks |
| CLS | Visual stability during load | Under 0.1 | Images without dimensions, late-loading ads |
| TTFB | Server response time | Under 800ms | Slow hosting, no caching |
| FCP | First content painted | Under 1.8s | Render-blocking CSS/JS |
Bookmark this table. When someone asks why their google site performance is suffering, you can usually trace it back to one of these five rows.
Server-Side Factors That Quietly Wreck Google Site Performance
Before you touch a single line of front-end code, look at your server. Nothing you do on the client side will save you if your server takes two seconds to respond.
TTFB is the metric to watch. Google recommends keeping it under 800 milliseconds, though under 200ms is ideal.

Shared hosting is the enemy here. If you’re on a budget plan with hundreds of other sites, your server response time will fluctuate wildly depending on your neighbors’ traffic.
Upgrading to a VPS or managed hosting often produces the single biggest improvement in google site performance. I’ve seen TTFB drop from 1.4 seconds to 180 milliseconds with nothing more than a hosting migration.
Caching Layers You Should be Using
Every serious site needs at least two caching layers: server-side caching (like Redis or Varnish) and a CDN.
Server-side caching stores rendered pages so your database doesn’t get hammered on every request. A CDN pushes static assets to edge servers close to your users.

Cloudflare, Fastly, and BunnyCDN all offer generous free or low-cost tiers. For most sites, Cloudflare’s free plan alone cuts global load times by 30-50%.
Don’t skip browser caching either. Setting long cache lifetimes for static assets means repeat visitors load your pages almost instantly.
Database Optimization
Slow database queries are a hidden tax on google site performance. Every uncached page load hits your database, and poorly indexed tables can add hundreds of milliseconds.
If you’re on WordPress, plugins like Query Monitor reveal slow queries. Cleaning up post revisions, transients, and orphaned metadata can dramatically reduce query times.

For custom applications, add indexes to columns you filter or sort by. It’s a five-minute change that can cut query times by 90%.
Front-End Optimizations That Move the Needle
Once your server is solid, turn your attention to the front end. This is where most of the visible google site performance gains live.
The goal is simple: send less, send it later, and send it compressed. Everything below serves that principle.
Image Optimization
Images are usually the heaviest assets on any page. Getting them right is non-negotiable.
Use modern formats like WebP or AVIF. They deliver equivalent quality at 25-50% smaller file sizes compared to JPEG and PNG.
Always specify width and height attributes to prevent layout shift. And lazy-load images below the fold—but never lazy-load your LCP image.
Tools like Squoosh, ImageOptim, and ShortPixel automate most of this. There’s no excuse for shipping a 2MB hero image in this day and age.
JavaScript and CSS Management
Every script and stylesheet you load is a potential bottleneck. Audit them ruthlessly.

Remove unused plugins, defer non-critical JavaScript, and inline critical CSS for above-the-fold content. Maintaining clarity across your google site performance remains essential. Tools like WP Rocket and Perfmatters handle this automatically on WordPress.
Code splitting is your friend on modern frameworks. Instead of loading one giant bundle, load only what each page needs.
I once cut a client’s JavaScript payload from 1.2MB to 340KB by removing three unused libraries and deferring the rest. Their INP improved from 320ms to 110ms, and google site performance scores jumped from 42 to 89.
Font Loading Strategy
Web fonts are lovely until they block your render. Host them locally, use font-display: swap, and preload the fonts you actually need.
Better yet, consider system fonts. They load instantly and look native on every device. Many high-traffic sites have abandoned custom fonts entirely for this reason.
If you must use custom fonts, subset them to include only the characters you need. A Latin-only subset can be 80% smaller than the full font file.

Mobile-First Google Site Performance
Google indexes the mobile version of your site first. If your mobile experience is sluggish, your desktop performance barely matters.
Mobile devices have less processing power, slower connections, and smaller viewports. Everything that’s marginal on desktop becomes critical on mobile.
Test on real devices, not just Chrome’s device emulator. Emulators don’t capture thermal throttling, network variability, or actual CPU limits.
A mid-range Android phone on a 4G connection is your realistic benchmark. If your site feels fast there, it’ll feel fast everywhere.
Common Mobile Performance Traps
Pop-ups and interstitials are the biggest offenders. Google penalizes intrusive interstitials, and they also destroy perceived performance.
Heavy hero videos are another trap. A thoughtful approach to google site performance reinforces your qualifications. Autoplaying video on mobile drains batteries and delays LCP. Use a poster image instead and load the video only on interaction.
Finally, watch your tap targets. Buttons smaller than 48×48 pixels cause mis-taps and frustrate users, even if they don’t directly affect Core Web Vitals.
Third-Party Scripts: the Silent Killer
Third-party scripts—analytics, ads, chat widgets, social embeds—are responsible for a huge share of google site performance problems.
The average page now loads dozens of third-party requests. Each one adds latency, and you have zero control over how they perform.
Audit them quarterly. Ask yourself: does this script justify its cost? If a tool hasn’t produced measurable value in three months, remove it.
Load third-party scripts asynchronously whenever possible. Never let a marketing tag block your main content from rendering.
For critical third parties, consider self-hosting. It gives you control over caching and eliminates DNS lookups to external domains.
Measuring Real User Experience Vs. Lab Data
Lab data tells you what could happen. Field data tells you what actually happens. For google site performance, field data wins every time.
CrUX data in PageSpeed Insights reflects the 75th percentile of real user experiences. If your CrUX scores are poor, real users are suffering, regardless of what Lighthouse says.
Set up Real User Monitoring (RUM) if you want continuous visibility. Tools like SpeedCurve, DebugBear, and Cloudflare Web Analytics provide ongoing field data.
The gap between lab and field often reveals device-specific issues. A page that scores 95 in Lighthouse might score 40 on real mobile devices due to CPU throttling.
Building a Performance Monitoring Routine
Optimization isn’t a one-time project. Google site performance degrades over time as you add features, plugins, and content.
Set up automated monitoring so regressions get caught early. A weekly check-in prevents small issues from becoming disasters.
Here’s the routine I recommend to every client:
- Weekly: Review Search Console Core Web Vitals report for new failing URLs.
- Bi-weekly: Run PageSpeed Insights on your top 10 landing pages.
- Monthly: Audit installed plugins and third-party scripts for bloat.
- Quarterly: Run a full WebPageTest audit and compare against previous results.
- After every major update: Re-test key pages before pushing to production.
This cadence catches most regressions within days rather than months. Structuring your google site performance around proven patterns ensures impact. It’s the difference between proactive maintenance and emergency firefighting.
Advanced Techniques for Serious Performance Gains
Once you’ve handled the fundamentals, these advanced tactics can push google site performance into elite territory.
They require more effort and technical skill, but the payoff is substantial—especially for high-traffic sites where every millisecond counts.
Edge Computing and Serverless Rendering
Edge computing moves rendering closer to users. Instead of a single origin server, your pages are generated at edge locations worldwide.
Cloudflare Workers, Vercel Edge Functions, and AWS Lambda@Edge make this accessible without massive infrastructure investment.
For sites with global audiences, edge rendering can cut TTFB to under 50 milliseconds in most regions. That’s a transformative improvement for google site performance.
HTTP/3 and QUIC
HTTP/3 uses QUIC, a transport protocol built on UDP. It reduces connection setup time and handles packet loss more gracefully than TCP.
Most major CDNs support HTTP/3 now. Enabling it is usually a single toggle in your CDN dashboard.
The gains are most noticeable on mobile networks where packet loss is common. Users on spotty connections see the biggest improvements.
Speculative Loading and Prefetching
Speculative loading predicts which page a user will visit next and preloads it in the background.
When done well, it makes navigation feel instantaneous. When done poorly, it wastes bandwidth and slows down the current page.
Use it selectively—on high-confidence navigation paths like product listings to product pages. Chrome’s Speculation Rules API makes implementation straightforward.
How Google Site Performance Impacts Business Metrics
Performance isn’t just a technical concern. Applying these principles to your google site performance yields measurable results. It directly affects revenue, and the data on this is unambiguous.
Amazon famously calculated that every 100 milliseconds of added latency cost them 1% in sales. That was years ago, and the stakes have only grown.
Walmart found that improving load time by one second increased conversions by 2%. For a retailer doing billions in revenue, that’s an enormous number.
Even small businesses feel this. A local service site I worked with cut their load time from 4.2 to 1.8 seconds and saw form submissions rise 41% in a single quarter.
Google site performance also affects ad performance. Slow landing pages get lower Quality Scores in Google Ads, which raises your cost per click.
Common Myths About Google Site Performance
Let’s clear up some persistent misconceptions that lead people astray.
Myth 1: A perfect Lighthouse score guarantees good rankings. Reality: Lighthouse is lab data. Google uses field data. A 100 score in Lighthouse means nothing if real users still experience slow loads.
Myth 2: You need to optimize everything at once. Reality: Focus on your highest-traffic pages first. Improving 20 key URLs often delivers more value than chasing perfection across thousands of low-traffic pages.
Myth 3: Faster is always better, no matter the cost. Reality: There’s a point of diminishing returns. Chasing the last 50 milliseconds often isn’t worth the engineering effort or the risk of breaking functionality.
Myth 4: Performance is a one-time fix. Reality: It’s an ongoing practice. Sites that ignore maintenance see their google site performance degrade within months.
When to Hire Help Vs. DIY
Some performance work is well within reach for a motivated site owner. Other tasks require genuine technical expertise.
If you’re comfortable with basic HTML, image optimization, and plugin management, you can handle 70% of typical improvements yourself.
Server configuration, database tuning, and advanced JavaScript optimization usually warrant professional help. A skilled developer can solve in hours what might take you weeks to figure out.
My rule of thumb: if a fix requires editing code you don’t understand, hire someone. Proper attention to your google site performance sets a strong baseline. The risk of breaking your site outweighs the cost savings.
That said, don’t hand over the entire project blindly. Stay involved, ask questions, and make sure you understand what’s being changed and why.
Frequently Asked Questions About Google Site Performance
Here is an in-depth breakdown of key considerations regarding this section:
What is a Good Google Site Performance Score?
There’s no single “score” that defines good google site performance. Instead, focus on Core Web Vitals thresholds: LCP under 2.5 seconds, INP under 200 milliseconds, and CLS under 0.1. If you hit all three, you’re in good shape.
PageSpeed Insights gives you a 0-100 score, but treat it as a rough indicator. Field data matters more than any single number.
How Often Should I Check My Site’s Performance?
Weekly for Search Console reports, monthly for deeper audits. After any major update or plugin installation, test immediately before pushing to production.
Automated monitoring tools can alert you to regressions without manual checks, which is worth the small monthly cost for most serious sites.
Does Google Site Performance Really Affect Rankings?
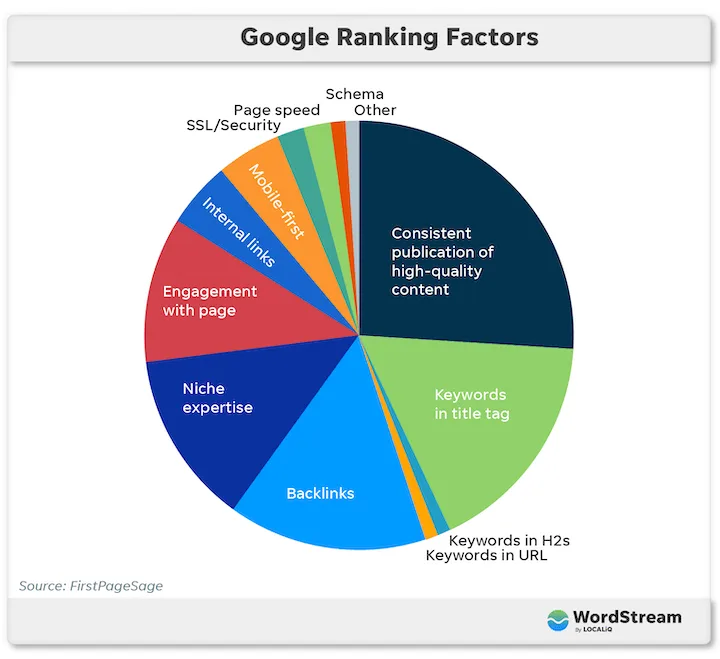
Yes, but it’s one factor among many. Content relevance, backlinks, and user intent matching all carry more weight individually.
However, google site performance acts as a multiplier. Great content on a slow site underperforms compared to the same content on a fast site. It’s the foundation everything else builds on.
Can I Improve Performance Without Touching Code?
Absolutely. Caching plugins, CDN setup, image compression tools, and plugin audits all deliver substantial gains without writing a line of code.
For WordPress users, plugins like WP Rocket, Perfmatters, and ShortPixel handle most common optimizations automatically.
Why Does My Site Score Well on Desktop but Poorly on Mobile?
Mobile devices have slower CPUs, less memory, and often weaker network connections. Scripts that run fine on desktop can choke mobile processors.
Test on real devices, not just emulators. Chrome’s device emulation doesn’t accurately simulate CPU throttling or thermal limits.
What’s the Fastest Way to See Improvement?
Compress your images, enable caching, and set up a CDN. These three changes typically deliver the biggest gains with the least effort.
Most sites see measurable improvement in google site performance within a week of implementing these basics.
Do I Need to Optimize Every Page on My Site?
No. Focus on your highest-traffic and highest-value pages first. Your homepage, top landing pages, and key conversion pages deserve priority attention.
Once those are solid, work through the rest systematically. Perfection everywhere isn’t necessary—excellence where it counts is.
How Does Hosting Affect Google Site Performance?
Hosting is foundational. A slow server caps your performance no matter how well-optimized your front end is.
If your TTFB consistently exceeds 800 milliseconds, your hosting is holding you back. Upgrading to better hosting often produces the single biggest improvement available.
Putting It All Together
Improving google site performance isn’t about chasing perfect scores. It’s about respecting your visitors’ time and removing every unnecessary obstacle between them and what they came for.
Start with measurement. Understand where you stand using PageSpeed Insights, Search Console, and WebPageTest. Then fix the biggest problems first—usually server response time and image weight.
Build a monitoring routine so regressions get caught early. And remember that performance work compounds: each improvement makes the next one easier and more impactful.
The sites that win in search are rarely the ones with the fanciest designs. They’re the ones that load fast, respond instantly, and never make users wait. That’s google site performance in a nutshell, and it’s entirely within your reach.
Pick one thing from this guide and fix it today. Then pick another tomorrow. Small, consistent improvements beat grand overhauls every single time—and your rankings, your conversions, and your visitors will thank you for it.
For verified reference and background research, consult the authoritative informational resource on this topic.