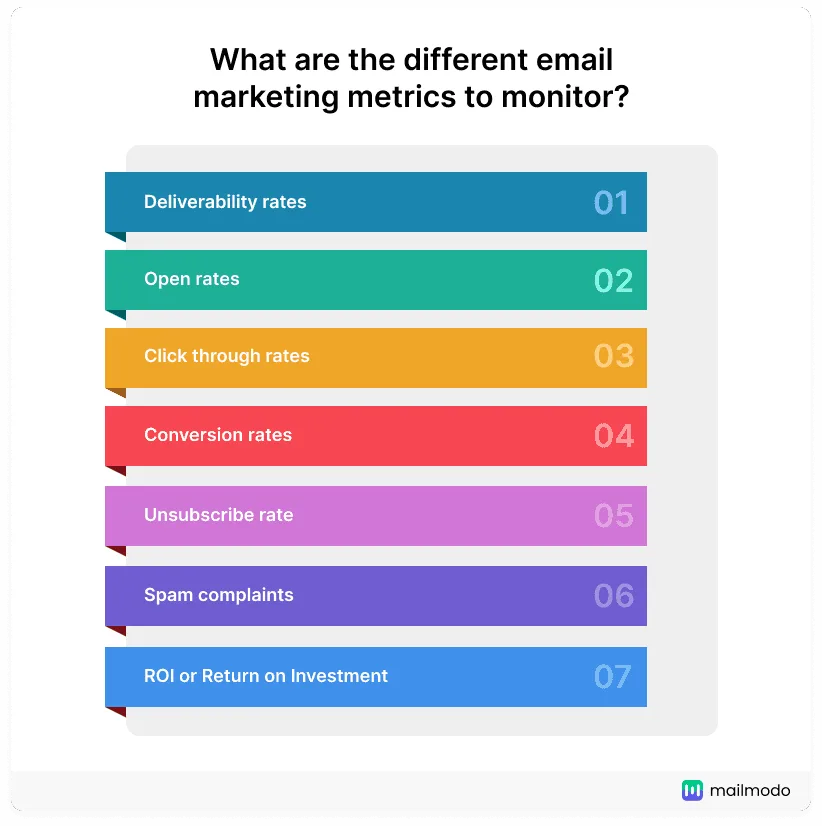
Email marketing metrics are the numbers that tell you whether your campaigns are actually working or just filling inboxes. If you have ever hit send, crossed your fingers, and hoped for the best, this guide is for you. I have spent years watching teams celebrate open rates while quietly ignoring the numbers that drive revenue.
So here is the honest truth: tracking the right email marketing metrics changes everything. This email marketing metrics guide walks through eleven expert tips that separate campaigns that convert from campaigns that just get deleted.
No fluff, no recycled advice — just the practices that hold up when you look at real dashboards week after week.
Why Email Marketing Metrics Decide Campaign Success
Every email you send generates a trail of data. Opens, clicks, bounces, unsubscribes, conversions — each one is a signal about how your audience feels. The problem is that most marketers look at two or three numbers and call it a day.
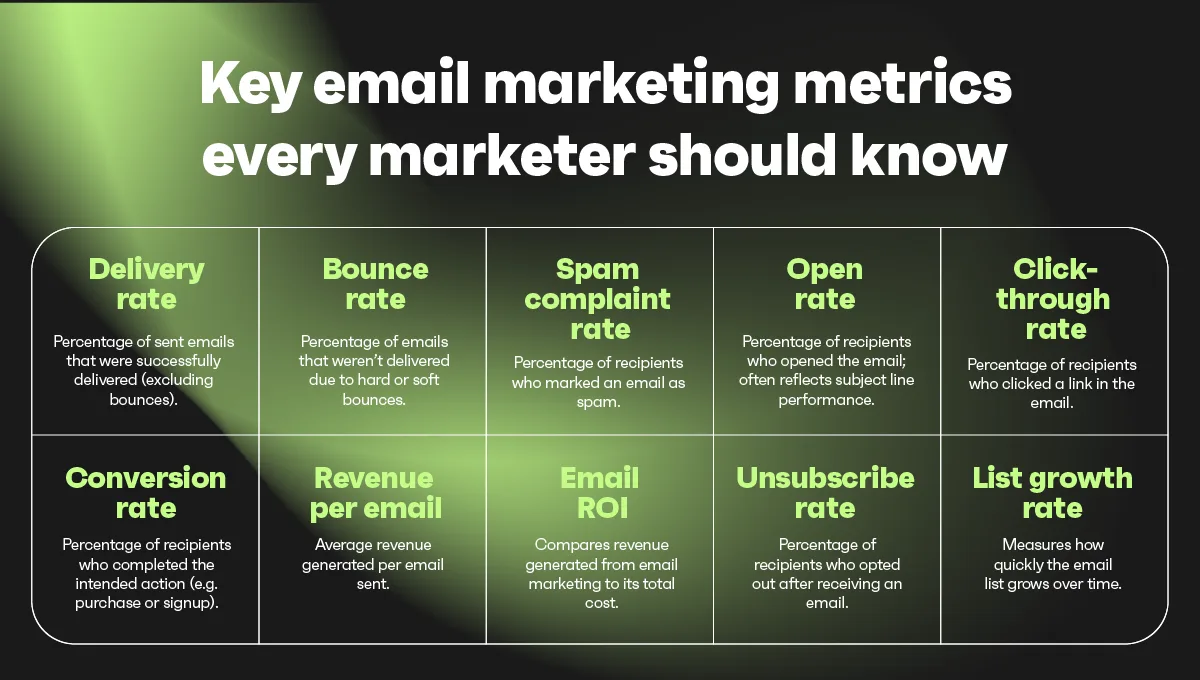
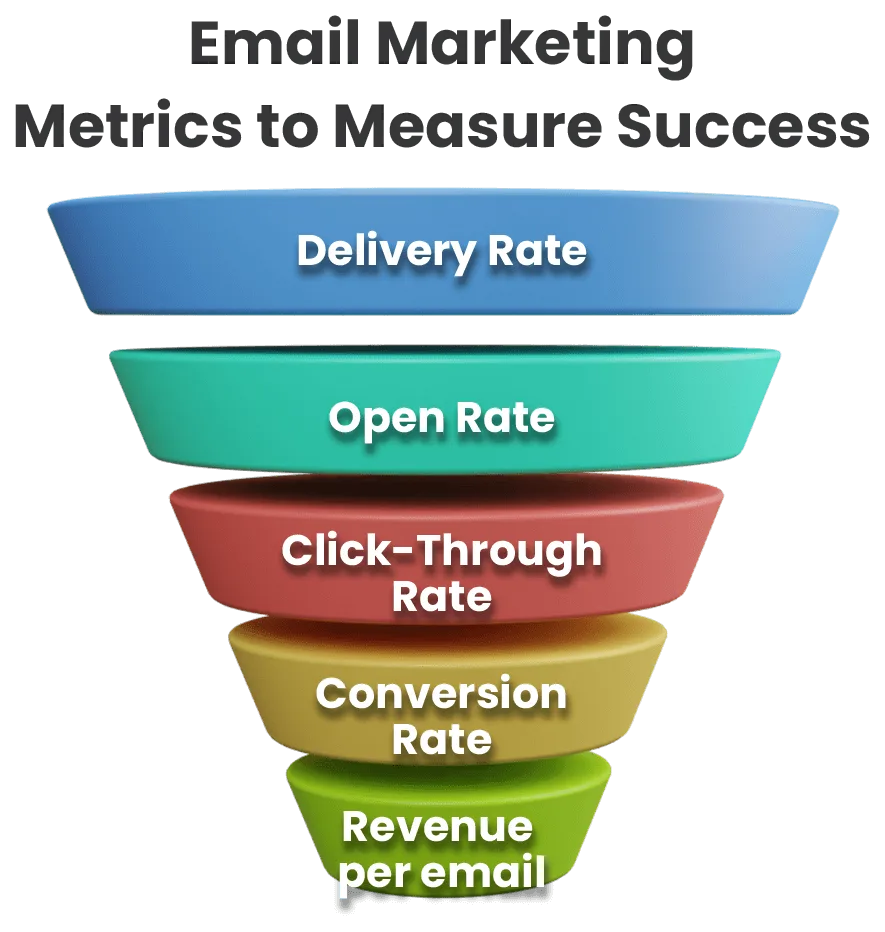
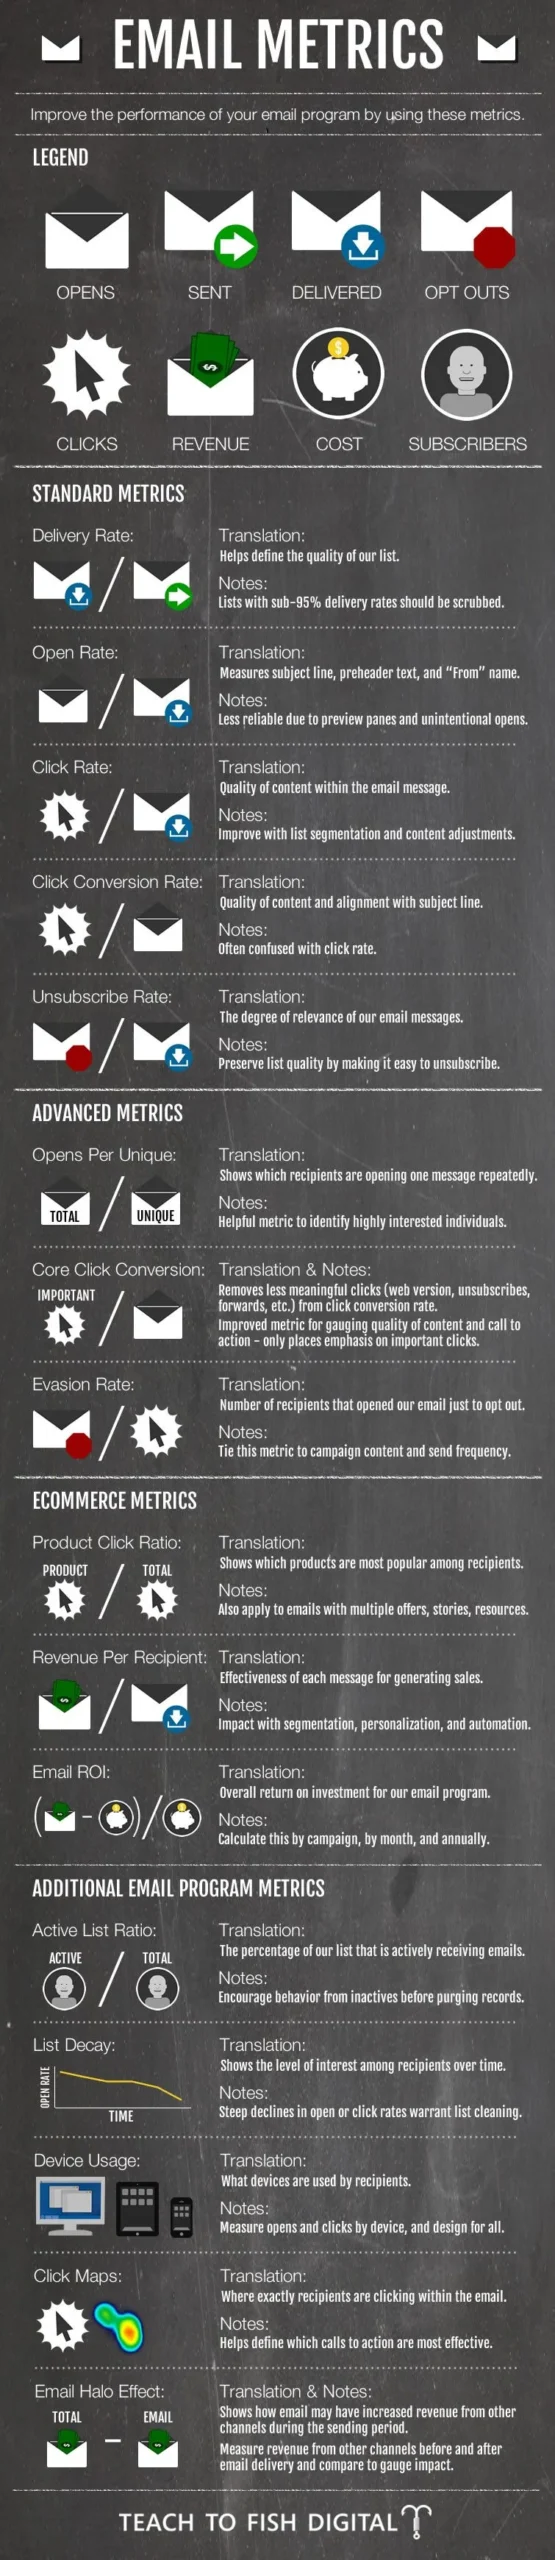
That habit costs money. When you treat email marketing metrics as a checklist instead of a diagnostic tool, you miss the story hiding in the data. A high open rate with a low click rate tells you the subject line works but the body copy does not. A healthy click rate with weak conversions means your landing page is dropping the ball.
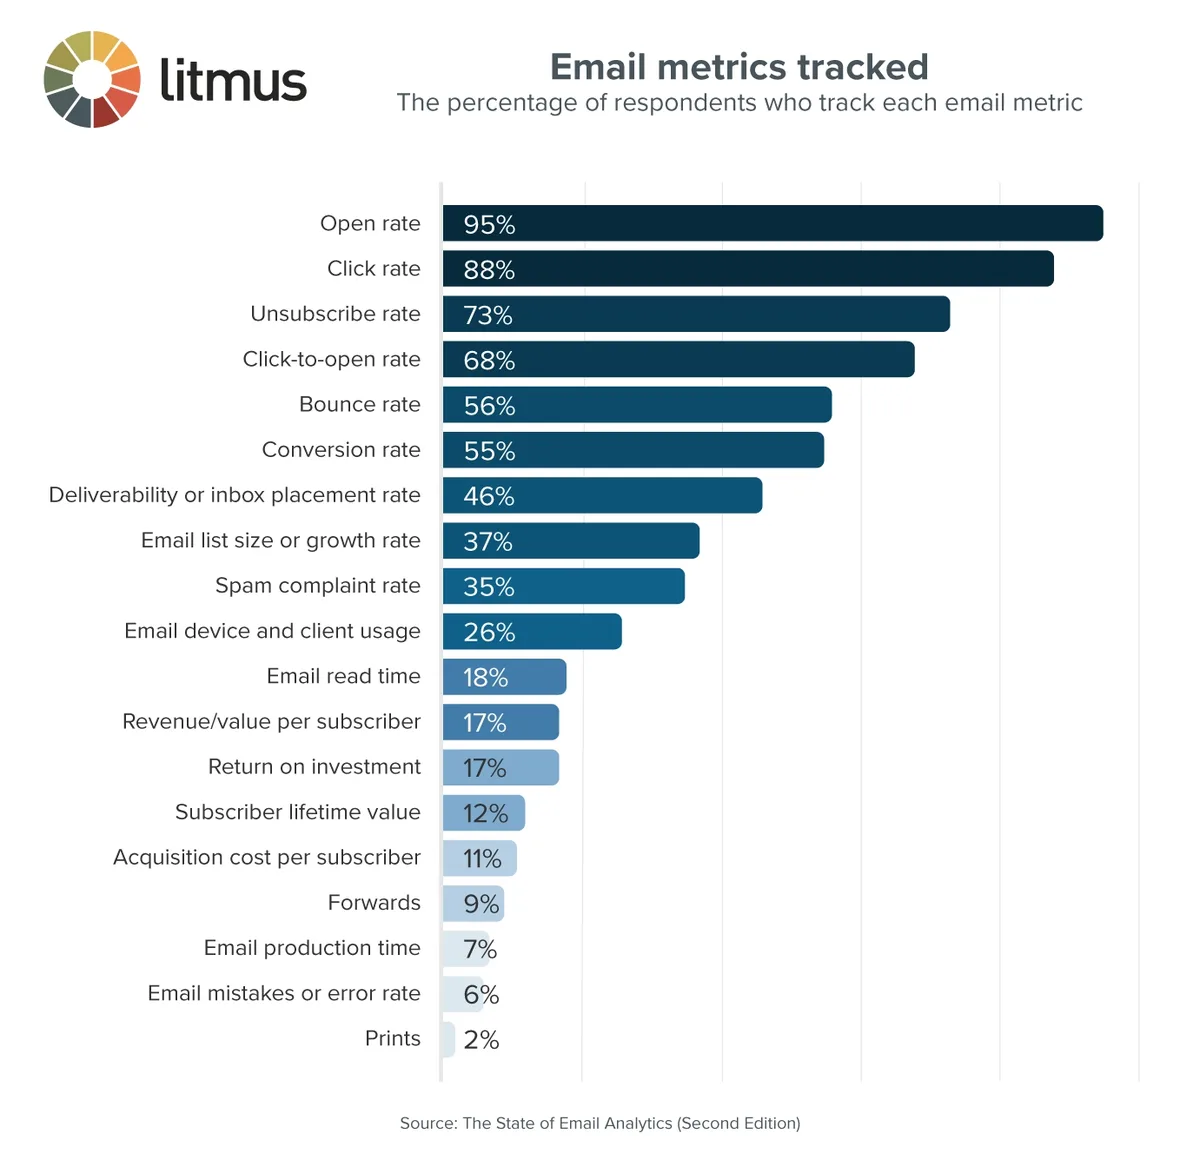
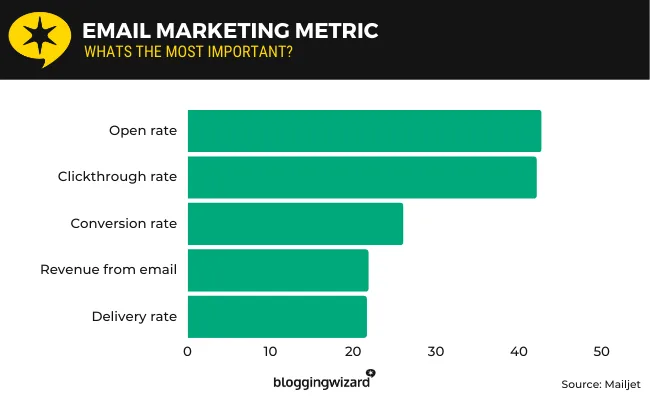
According to Litmus, the average email open rate hovers around 40% across industries, but click-through rates often sit below 3%. That gap is where opportunity lives. The tips below are built to help you close it.
Tip 1: Track Open Rate With Context, Not Obsession
Open rate is the first email marketing metric most people learn, and it is also the most misunderstood. Apple’s Mail Privacy Protection changed the game by pre-loading images, which inflates opens for a large chunk of your list. Chasing open rate in isolation is like judging a restaurant by how many people walk past the window.
Use open rate as a directional signal, not a verdict. Compare it week over week within the same segment, and pair it with click data before drawing conclusions. If opens jump 15% but clicks stay flat, you probably have a subject line that overpromises.
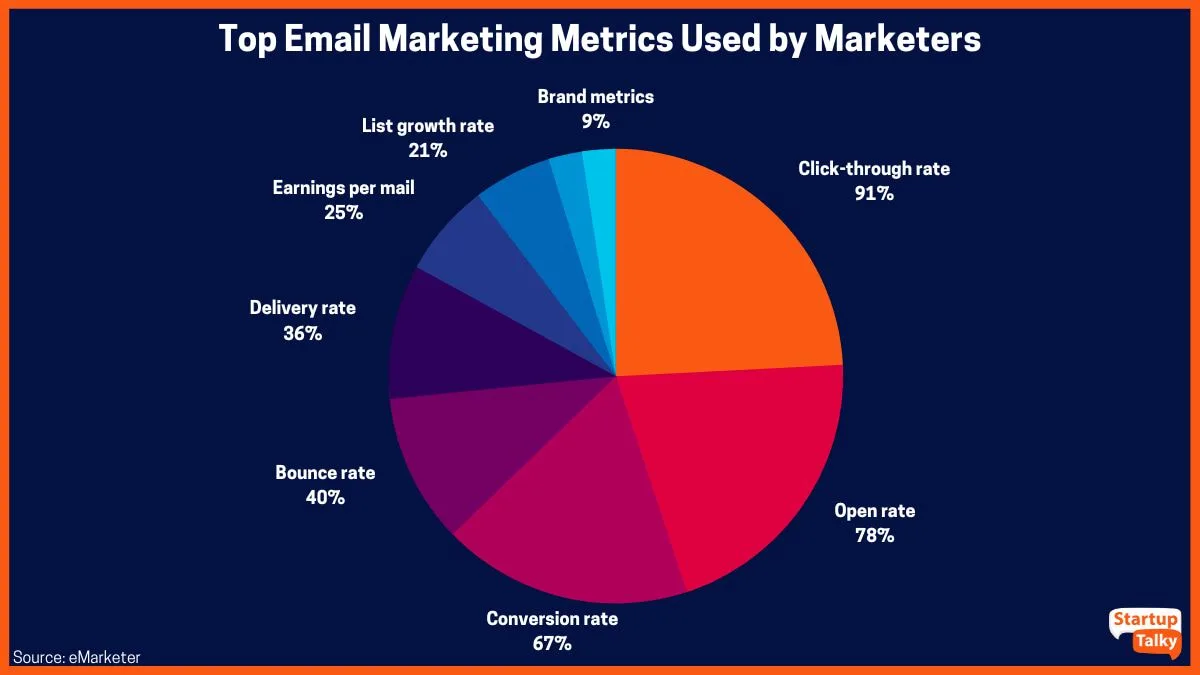
One practical habit: tag your sends by subject line style, then review open rate by tag every month. Over time you build a pattern library that tells you which angles actually earn attention. That is how email marketing metrics tips become real decisions instead of vanity charts.
Tip 2: Measure Click-Through Rate at the Link Level
Aggregate click-through rate hides more than it reveals. The real insight sits at the link level, where you can see which buttons, headlines, and offers pull people forward. A campaign with a 2.8% CTR might have one link carrying 70% of the clicks while the rest sit idle.
Pull a link-level report after every send. Focusing on email marketing metrics provides clear direction here. Sort by clicks, then ask why the top link won. Was it placement? Wording? A specific benefit? Then look at the bottom performers and cut or rewrite them next time.
This is one of the most underused email marketing metrics best practices. Most platforms give you the data for free, yet few teams dig in. Do it for two months and you will spot patterns fast — like the fact that text links often beat styled buttons in plain-text-feeling newsletters.
Tip 3: Watch Conversion Rate as the True North
Clicks are interest. Conversions are commitment. Conversion rate measures how many recipients completed the action you actually care about — a purchase, a signup, a demo request, a download.
Track conversion rate per campaign, but also track it per segment and per offer type. A welcome email might convert at 8% while a re-engagement blast converts at 0.4%. Comparing them directly is pointless; comparing each to its own baseline is where the value sits.
Set up UTM parameters consistently so your analytics platform can attribute revenue back to the send. Without that link, you are guessing. With it, email marketing metrics become a revenue story your finance team actually respects.
Tip 4: Read Bounce Rate Before You Blame Your Copy
A spike in bounces rarely means your writing went bad overnight. It usually means list hygiene slipped. Hard bounces are permanent failures — the address is dead. Soft bounces are temporary, often caused by a full inbox or a server hiccup.
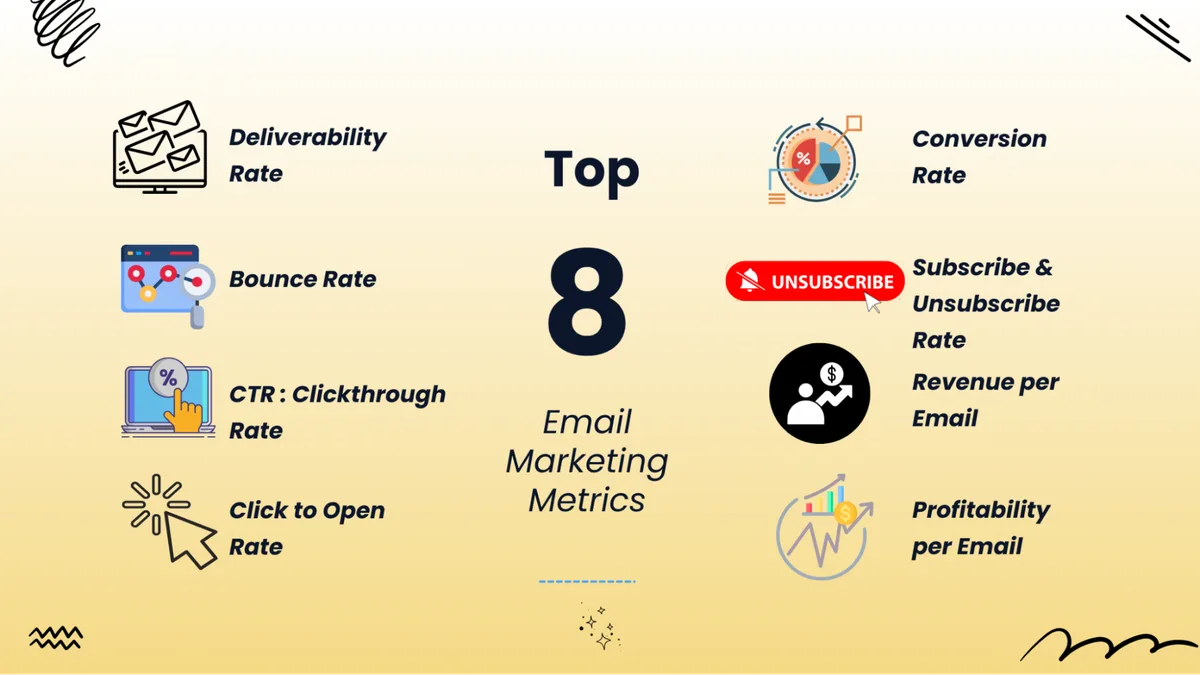
Keep your hard bounce rate under 2%, and clean your list the moment it creeps higher. Most ESPs auto-suppress hard bounces, but you should still review the trend monthly. A rising soft bounce rate can signal deliverability trouble worth investigating with your sending domain.
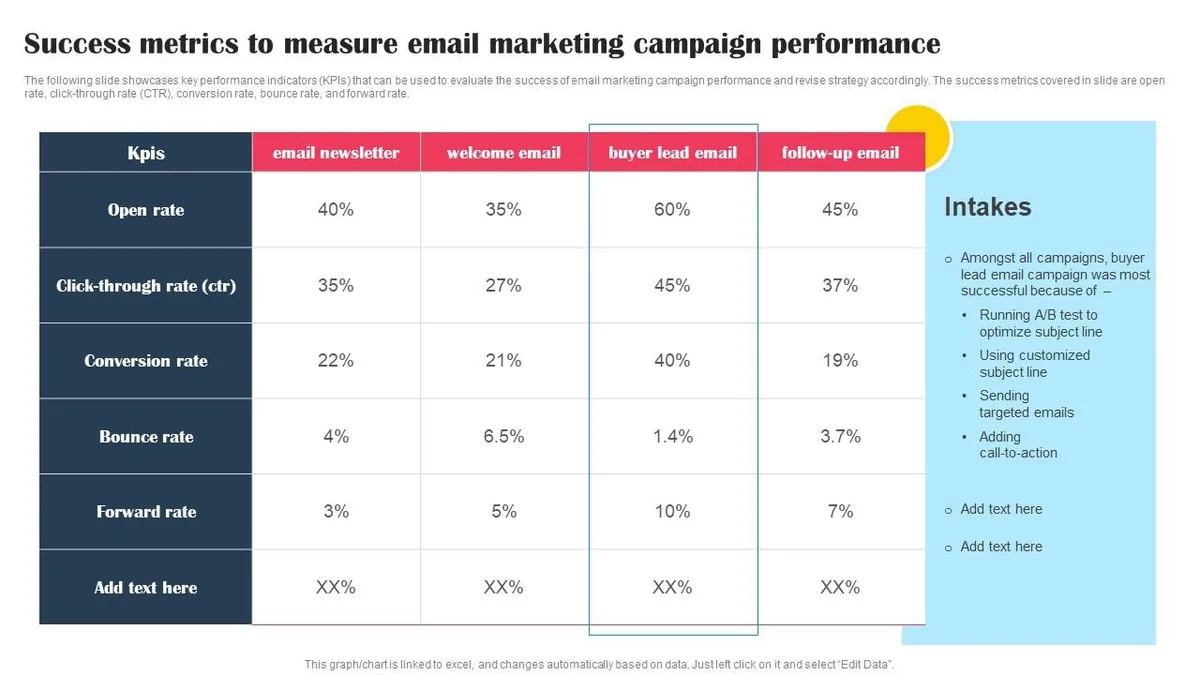
Here is a quick reference table for the benchmarks that matter most:
| Metric | Healthy Range | Warning Sign |
|---|---|---|
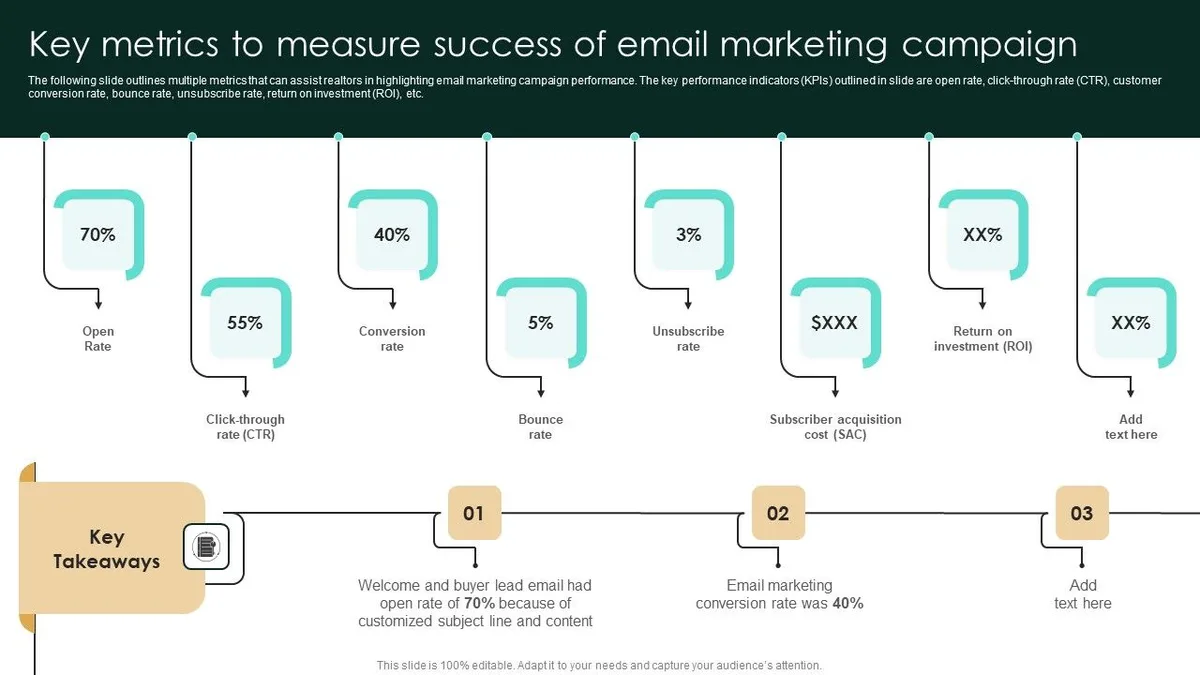
| Open Rate | 35% – 45% | Below 20% consistently |
| Click-Through Rate | 2% – 4% | Below 1% |
| Hard Bounce Rate | Under 2% | Above 3% |
| Unsubscribe Rate | Under 0.5% | Above 1% |
| Conversion Rate | 1% – 5% | Below 0.5% |
Treat those ranges as starting points, not laws. Your industry, list age, and offer type all shift the numbers. The point is to know your own baseline and spot drift early.
Tip 5: Treat Unsubscribe Rate as a Feedback Loop
Unsubscribes sting, but the email marketing metrics are honest. Someone telling you they are leaving is more useful than someone silently ignoring you for a year. A healthy unsubscribe rate sits under 0.5% per send; anything above 1% deserves a hard look.
When unsubscribes spike, check three things: send frequency, list source, and offer relevance. A sudden jump after a frequency increase is a clear message. A jump after a co-registration campaign usually means you bought low-intent contacts.
Do not just watch the number — read the exit surveys if your platform offers them. Even a handful of “too many emails” responses gives you a concrete fix. This is where email marketing metrics become a conversation with your audience rather than a scoreboard.
Tip 6: Segment Every Metric by Audience Cohort
Blended numbers lie. Your overall open rate might look fine while your most valuable segment — say, customers who bought in the last 90 days — is disengaging. Segmenting your email marketing metrics by cohort is the single highest-leverage habit in this list.
Start with three splits: new subscribers, active customers, and lapsed contacts. Then compare open, click, and conversion rates across those groups. You will almost always find one segment carrying the whole program while another quietly bleeds.
From there, build a simple email marketing metrics checklist for each cohort. New subscribers need onboarding metrics. Active customers need repeat-purchase metrics. Lapsed contacts need reactivation metrics. Same dashboard, different questions.
Tip 7: Benchmark Against Yourself First, Industry Second
Industry benchmarks are useful context, but they are terrible targets. A 22% open rate might be average for e-commerce and excellent for a B2B newsletter with a small, senior list. Chasing someone else’s number distorts your priorities.
Build a rolling 90-day baseline for each core metric, then measure every campaign against that. Only after you know your own trend should you peek at industry data — and even then, use it to ask better questions, not to set goals.
This is one of those email marketing metrics best practices that sounds obvious and gets ignored constantly. The teams that win are the ones comparing this month to their own last twelve, not to a blog post’s average.
Tip 8: Attribute Revenue With a Consistent Model
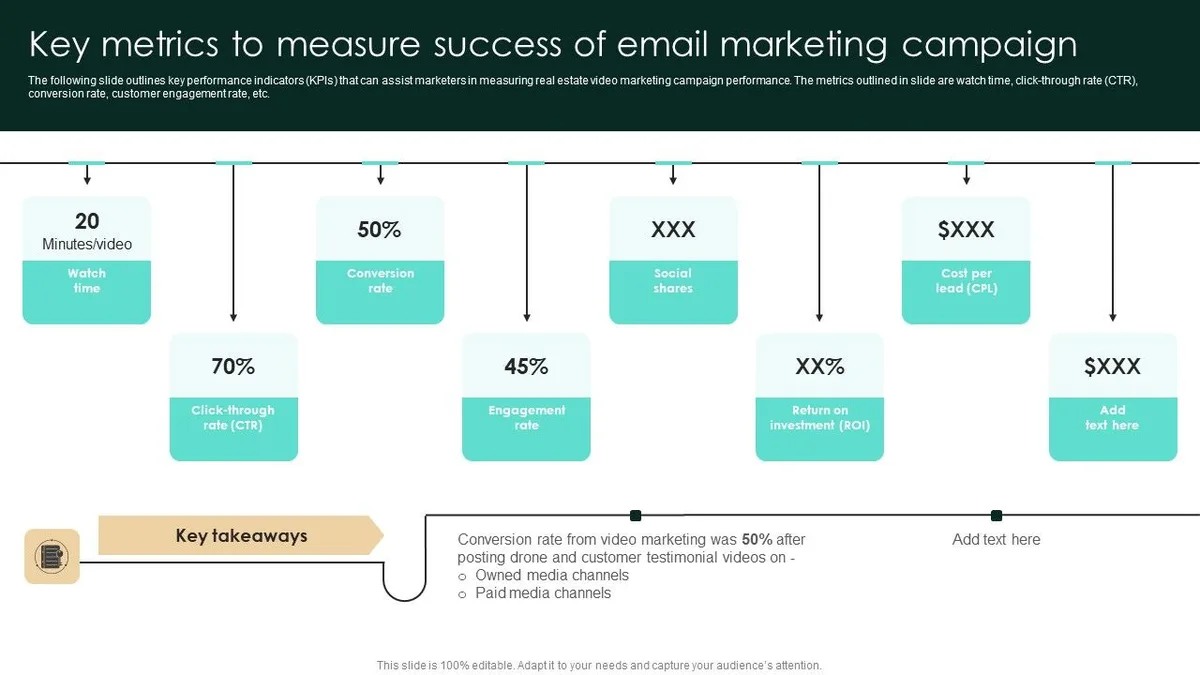
Revenue attribution is where email marketing metrics get political. Last-click, first-click, linear, and time-decay models all tell different stories about the same send. Pick one model, document it, and stick with it long enough to see trends.
For most teams, a simple rule works: credit the email if it was the last touch before purchase, and separately track assisted conversions for emails that appeared earlier in the journey. That gives you both the direct number and the influence number.
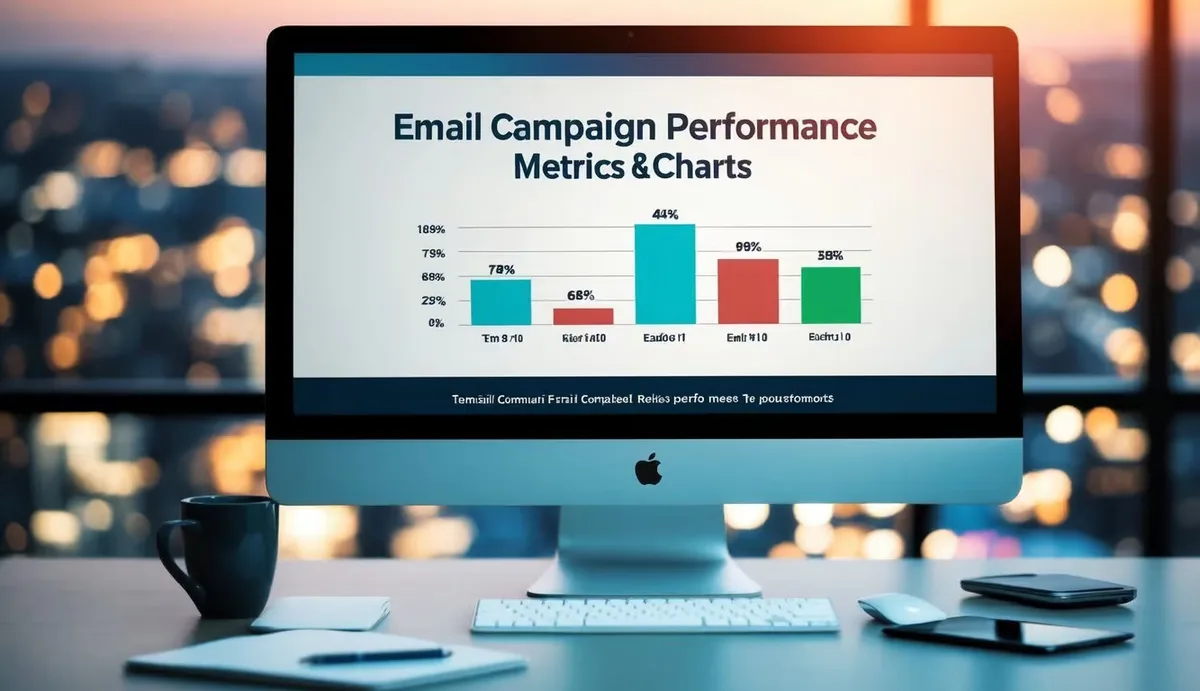
Make sure your platform and your analytics tool agree on the definition. Effective execution in your email marketing metrics makes a tangible difference. When they disagree, you get the classic meeting where two people present two revenue figures and everyone leaves confused. Consistency beats sophistication every time.
Tip 9: Use A/B Tests to Validate, Not Decorate
Running an A/B test on every subject line feels productive. It usually is not. Most tests lack the sample size to produce a meaningful result, so teams end up “learning” from noise.
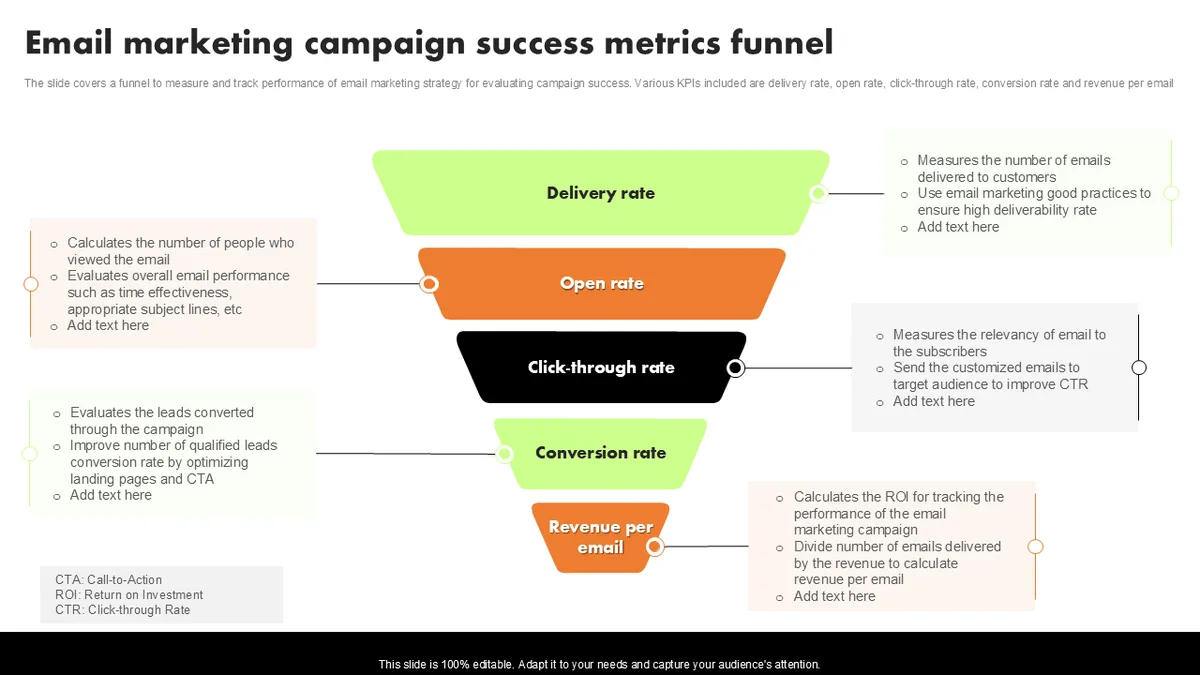
Test fewer things, but test them properly. Pick one variable, run it across a segment large enough to matter, and let it run long enough to reach significance. Then document the result in a shared log so the learning survives staff turnover.
The email marketing metrics tips that actually move the needle are boring: consistent testing, clear hypotheses, and a written record. Skip the decoration and build the discipline.
Tip 10: Monitor List Growth and Churn Together
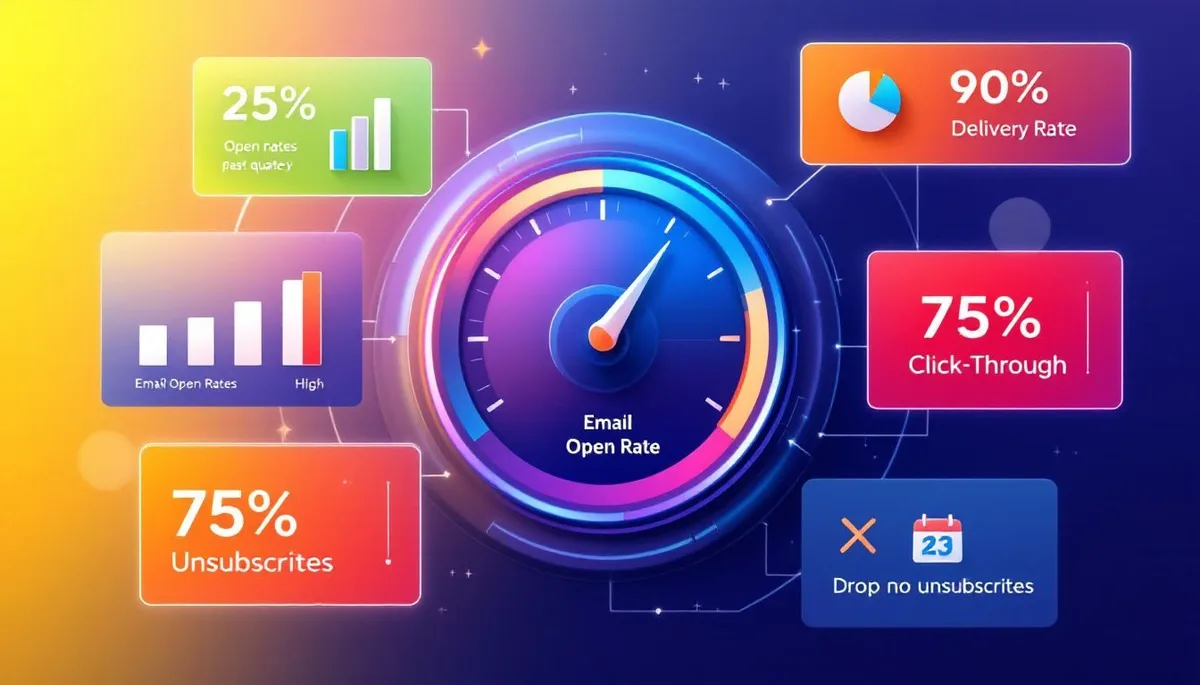
List growth without context is a trap. You can add 5,000 subscribers this month and still be shrinking your engaged audience if 6,000 went cold. Track net engaged growth — new subscribers minus unsubscribes, hard bounces, and long-term inactives.
Set a simple rule: any contact who has not opened in 180 days gets a re-permission email. If they do not respond, suppress them. This keeps your deliverability strong and your email marketing metrics honest.
Many teams resist suppression because the list number feels like a KPI. It is not. A smaller, engaged list outperforms a bloated one on every metric that matters — open rate, click rate, conversion, and revenue per send.
Tip 11: Build a Weekly Dashboard You Actually Read
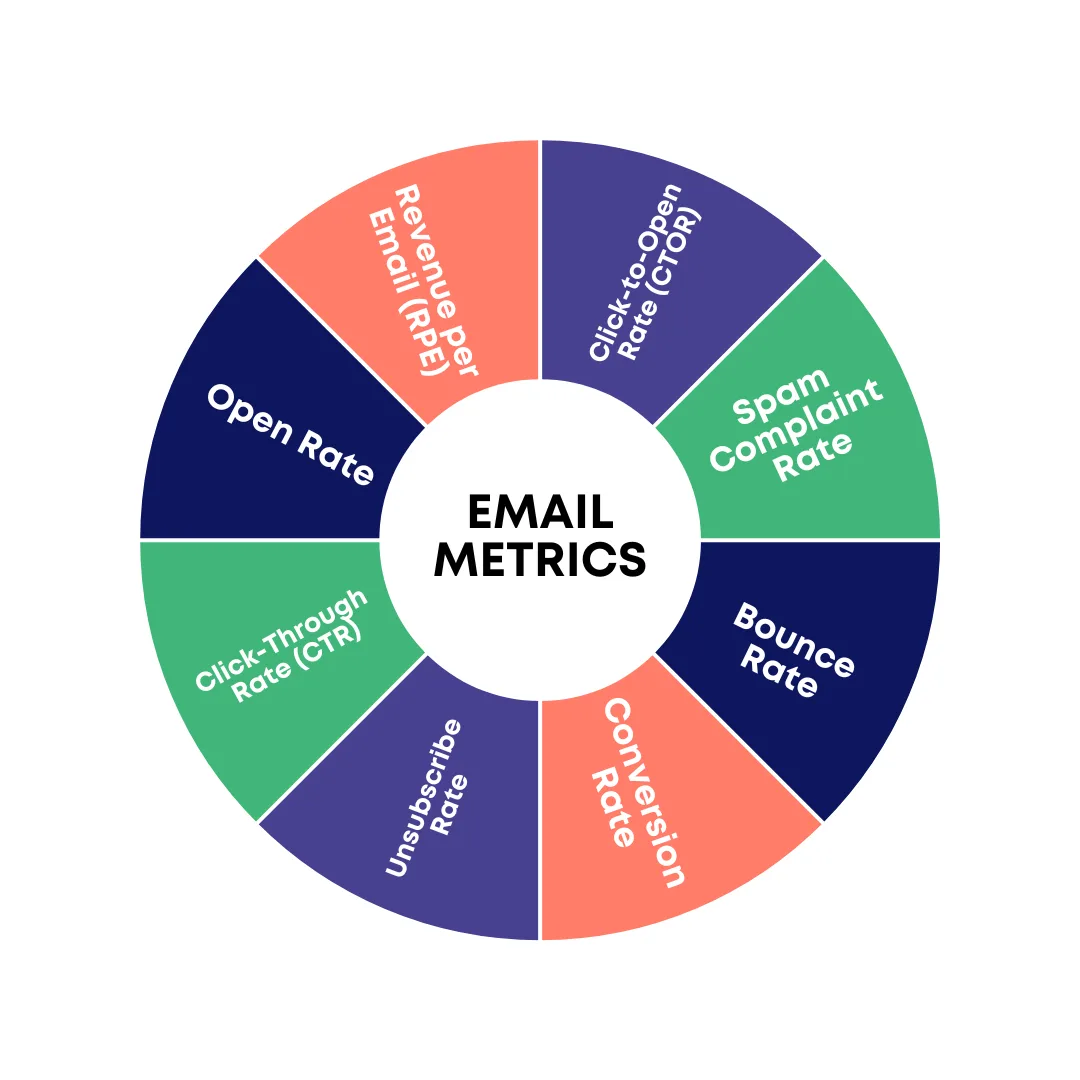
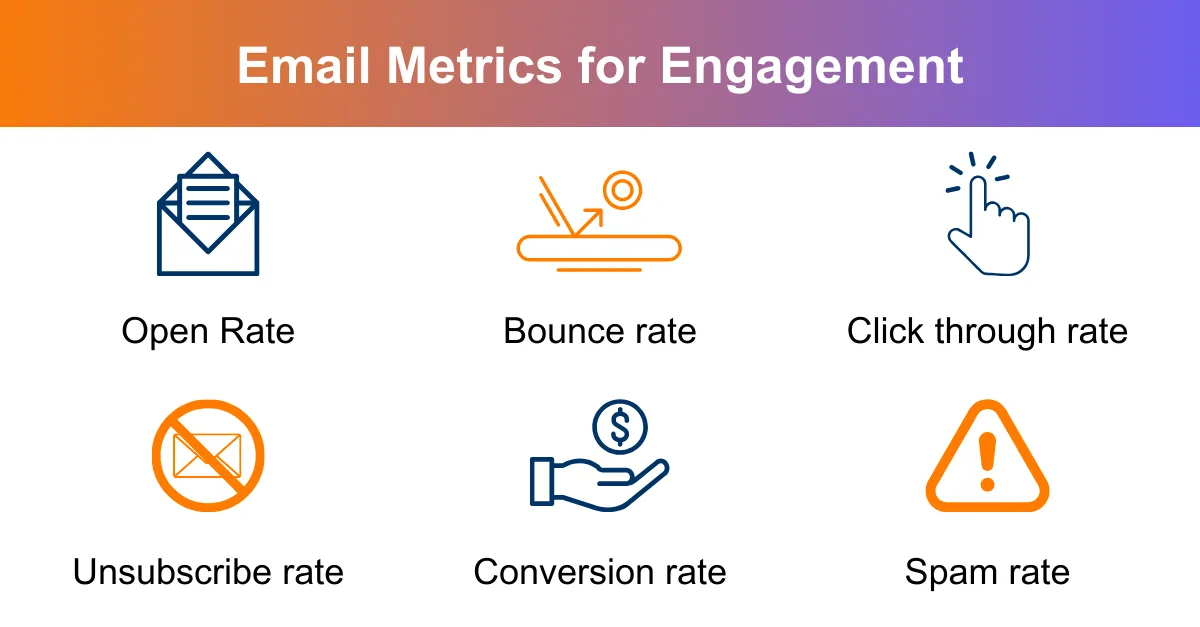
The best email marketing metrics checklist is the one you look at every Monday. Build a single dashboard with five numbers: open rate, click-through rate, conversion rate, unsubscribe rate, and revenue per send. Add segment filters and a 90-day trend line.
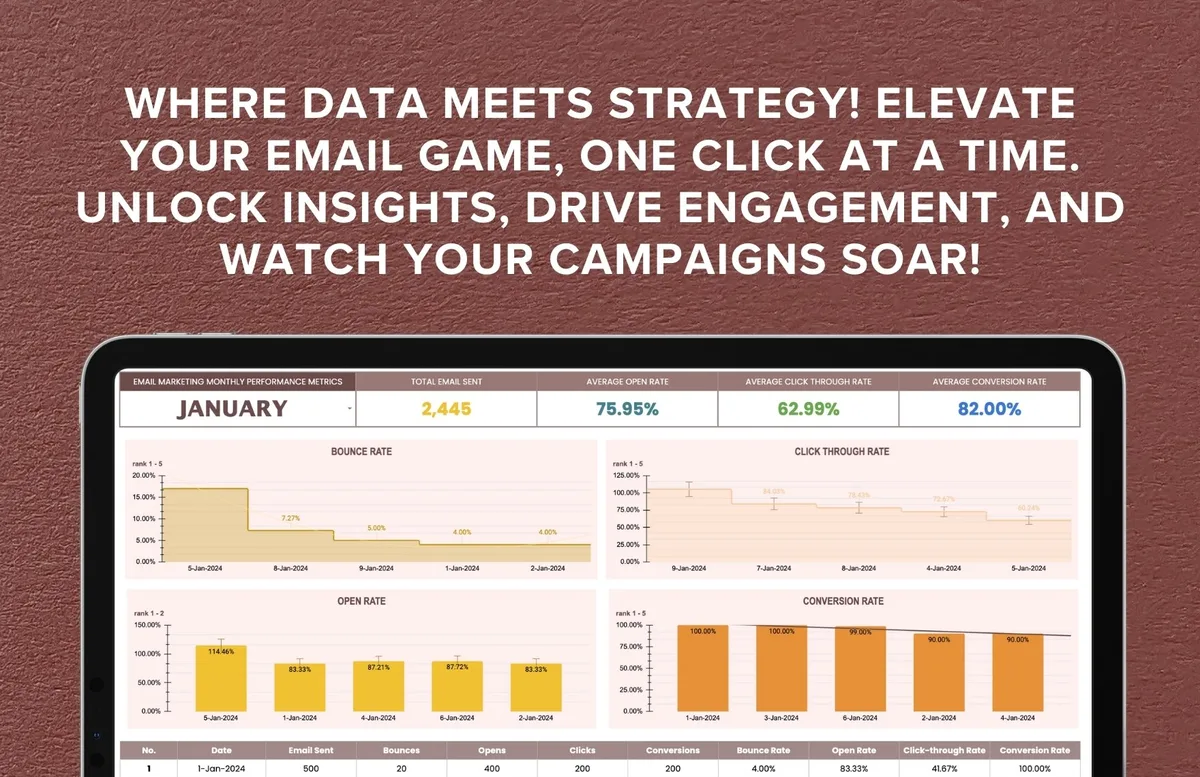
Keep it boring and consistent. The goal is not a beautiful dashboard — it is a habit of noticing change. When a number moves, you investigate. When it does not, you move on to the next campaign.
Review the dashboard in a 15-minute weekly meeting with whoever owns the program. That rhythm turns email marketing metrics from a monthly report into a live feedback loop. Over a quarter, the compounding effect is enormous.
How to Choose the Right Email Marketing Metrics for Your Goals
Not every metric deserves equal weight. Maintaining clarity across your email marketing metrics remains essential. A welcome series should be judged on activation and early engagement. A promotional blast should be judged on revenue and conversion. A newsletter should be judged on open rate, click rate, and reply rate.
Map your metrics to your campaign type before you send. Write the goal in one sentence, then pick the two or three numbers that prove it. If you cannot name them, the campaign is not ready to go out.
This alignment is what separates a real email marketing metrics guide from a generic list. The numbers only matter in relation to the job they are doing. A metric without a goal is just a number on a slide.
Common Email Marketing Metrics Mistakes to Avoid
The most common mistake is celebrating opens as if they were revenue. The second is ignoring unsubscribes because they feel negative. The third is testing without a hypothesis and calling the result a learning.
Another quiet killer: inconsistent tracking. If your UTM parameters change format every month, your attribution breaks and your historical data becomes useless. Standardize your naming convention and enforce it.
Finally, do not let your dashboard become a museum. Metrics are meant to trigger action. If a number moves and nobody changes anything, the dashboard is decoration. The whole point of email marketing metrics is to make better decisions faster.
Frequently Asked Questions About Email Marketing Metrics
Here is an in-depth breakdown of key considerations regarding this section:
Which Email Marketing Metric Matters Most?
Conversion rate, followed closely by revenue per send. Opens and clicks are leading indicators, but conversion is where business value shows up. Track all of them, but let conversion drive your priorities.
What is a Good Open Rate?
Across industries, 35% to 45% is healthy, though Apple’s privacy changes inflate this number for many lists. Compare against your own 90-day baseline rather than a generic benchmark.
How Often Should I Review Email Marketing Metrics?
Weekly for the core five, monthly for segment-level trends, and quarterly for a deeper audit. The weekly rhythm is what builds the habit of noticing change before it becomes a problem.
Should I Track Metrics per Campaign or per Subscriber?
Both. Campaign-level metrics tell you what happened. Subscriber-level metrics — like engagement score or lifetime value — tell you who is driving the result. The second view is where segmentation strategy comes from.
Putting These Email Marketing Metrics Tips Into Practice
Start small. Pick three tips from this list and apply them to your next two sends. Build your dashboard, set your baseline, and commit to a weekly review. The compounding effect of consistent measurement beats any single clever campaign.
Remember that email marketing metrics are not a scoreboard to impress leadership — they are a conversation with your audience. Every number is a signal about what they want, what they ignore, and what makes them leave. Listen closely, and the program improves on its own.
If you want to go deeper, the natural next step is building a proper email marketing metrics checklist for each campaign type, then layering in deliverability monitoring and lifecycle segmentation. That is the path from tracking numbers to running a program that reliably earns its place in the inbox.