Why SEO Statistics Matter More Than Ever
SEO statistics are the closest thing our industry has to a shared language, and if you’ve ever had to justify a budget line to a skeptical CFO, you already know why they matter. Numbers cut through opinion. They turn “we should probably invest in search” into “here’s what happens when we don’t.”
I’ve spent years building content roadmaps, and the single most useful habit I’ve picked up is keeping a running file of stat-driven arguments — the kind of figures that make a room go quiet for a second.
This SEO statistics guide is exactly that file, organized. Twenty-five stats, grouped into five clusters so you can grab the one you need without scrolling through a wall of charts.
Each stat comes with context on why it matters and how to actually use it in a pitch, an audit, or a content brief.
How This Stat Collection is Organized
Twenty-five numbers split into five buckets: click behavior, traffic economics, technical health, content performance, and conversion signals.
That structure mirrors how a real search program gets built — start with what users click, then the money, then the plumbing, then the content, then what happens after the click.
If you’re building an SEO statistics checklist for an internal presentation, these five clusters map neatly onto five slides.
How to Read These Numbers Without Overinterpreting Them
Most SEO data comes from studies with specific sample sizes, verticals, and methodologies. Focusing on SEO statistics provides clear direction here. A 40% click-through rate for position one on a commercial query doesn’t mean every site gets 40%.
My rule: use stats for direction, use your own analytics for decisions. A study tells you organic traffic probably matters; your own Search Console data tells you it does for your pages.
Keep that distinction sharp and you’ll avoid the trap of citing a stat that collapses under one follow-up question.
Search Behavior and Click-Through SEO Statistics
Everything downstream depends on the SEO statistics cluster. If nobody clicks, nothing else matters. These stats quantify how people actually use the search results page.
The 25 Stats: Click Behavior
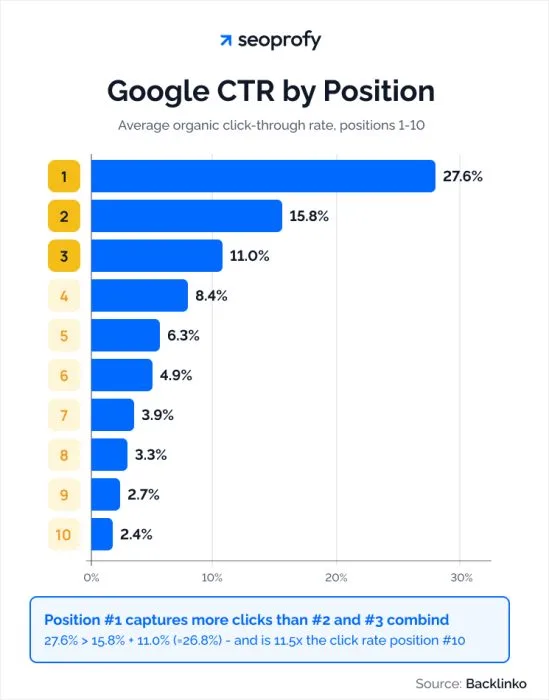
- Roughly 27% of all clicks on Google go to the top organic result. Position one is still the single most valuable piece of digital real estate on the web. Practical application: when you audit a client’s keyword map, identify which queries they sit at positions three through five for — those are the cheapest wins, because jumping from four to one can triple clicks without a single new page.
- About 39% of total clicks land on the first three organic positions combined. The distribution is steep, not gentle. In practice, this means a page ranked sixth isn’t “almost ranking” — it’s operating on scraps. Shift resources toward pages already at positions two through four before funding new content from scratch.
- Paid ads capture roughly 2.8% of all clicks on a search results page. Organic dominance holds even on commercial queries with heavy ad presence. If a stakeholder insists paid is eating organic’s lunch, walk them through this figure alongside their own impression share data.
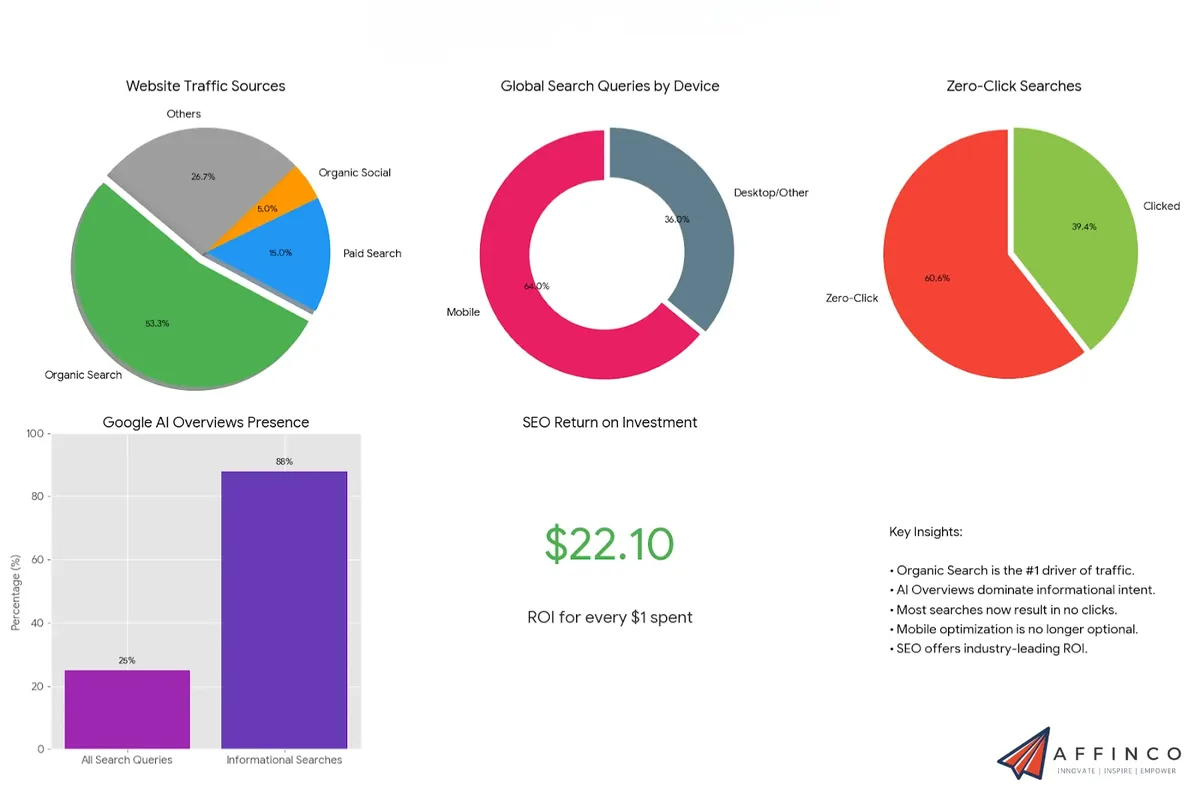
- Around 60% of searches end without a click at all. Zero-click searches are the norm, not the exception — featured snippets, knowledge panels, and local packs absorb the answer. The strategic response is to target featured snippets deliberately and treat brand visibility as a win even without a session.
- Roughly 8% of search queries are phrased as questions. People search conversationally, and question-based queries are the most reliable predictor of intent. Build an FAQ block around real question phrasing pulled from People Also Ask and you’ll catch traffic your competitors miss.
- Around 15% of Google queries are brand-new, never-before-searched terms. Fresh queries mean discovery still matters. Keyword research isn’t a one-time spreadsheet task — trend monitoring catches demand before tools index it.
Here’s the pattern I keep noticing: the click-behavior stats are the ones the SEO statistics shift internal politics fastest. When leadership sees that positions four through ten split a sliver of traffic, “we’re on page one” stops being a goal and starts being a false finish line.
What This Means for Your Content Strategy
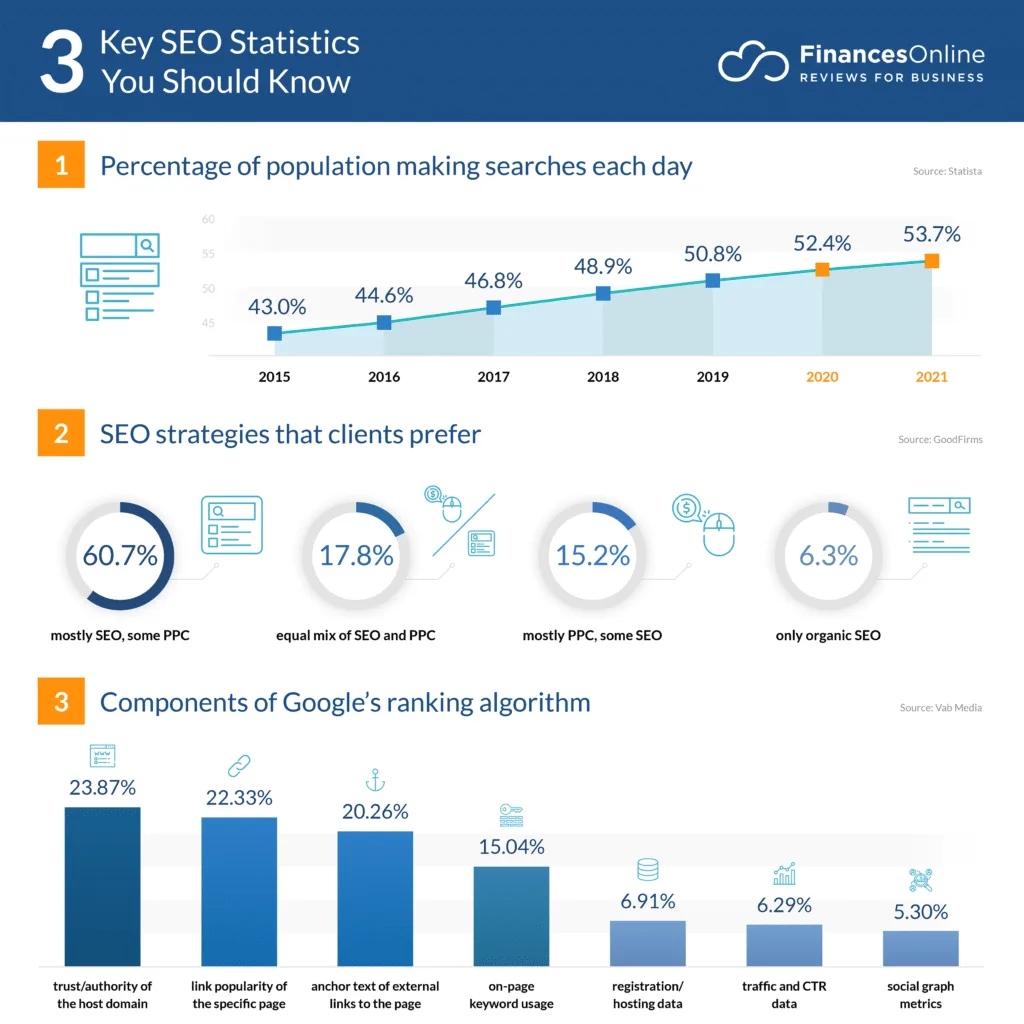
Click-behavior data pushes the SEO statistics toward a ruthless prioritization habit. Chasing a keyword where you rank eleventh is usually worse ROI than defending a keyword where you rank second.
Start your SEO statistics best practices review with a quick CTR-versus-position export from Search Console and compare it to the benchmarks above.
The gaps you find are your action list.
Traffic and Market Economics SEO Statistics
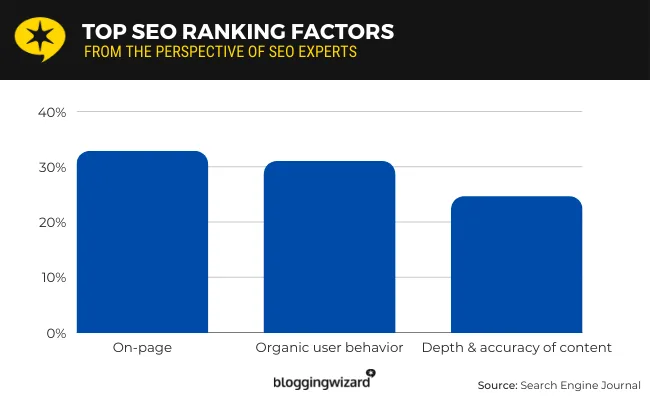
The SEO statistics cluster is the money slide. Organic search’s value is easiest to prove when you translate traffic into market dynamics and budget conversations.
The 25 Stats: Traffic and Market Economics
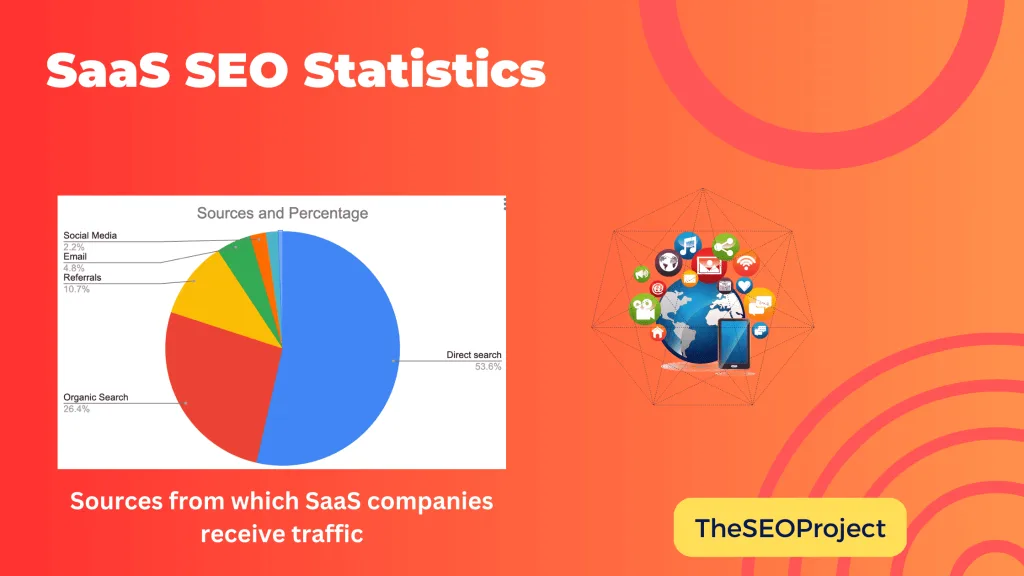
- Search engines drive roughly 68% of all trackable website traffic worldwide. Search isn’t one channel among many — it’s the channel, and everything else competes for the remainder. Position SEO as the baseline layer of an acquisition strategy rather than a campaign.
- Google accounts for over 90% of global search engine market share. Concentration is a risk factor as much as an opportunity. Any serious SEO statistics tips list should include a note about diversifying off YouTube, Microsoft properties, and direct brand demand.
- Organic search delivers roughly 53% of all trackable website traffic across industries. For most publishers and ecommerce sites, organic is the largest single source. When channel attribution arguments get heated, this is the number that settles them.
- Organic search leads all other channels for ROI in marketer surveys. Respondents consistently rank SEO ahead of paid social and display for return on investment. Forecast conservatively and over-deliver; the channel’s reputation depends on it.
- Organic search produces significantly more web traffic than paid search overall. Paid search is precise but finite; organic is compounding but slow. Budgeting both as a literal 1:1 trade harms the compounding side.
- Mobile devices account for roughly two-thirds of organic search visits. Your desktop experience is a demo environment. Test every layout decision on a mid-range Android phone before sign-off.
- Organic search drives over half of traffic for B2B technology companies in industry studies. The “B2B buyers don’t search” myth dies here. They research heavily — they just convert later and via longer paths.
One caution: the SEO statistics aggregate figures come with methodology caveats. “Trackable traffic” excludes apps, email dark social, and privacy-blocked sessions.
Treat the percentages as relative signal, not absolute measurement. Your own analytics will tell you where you sit within the range.
Building a Business Case With These Numbers
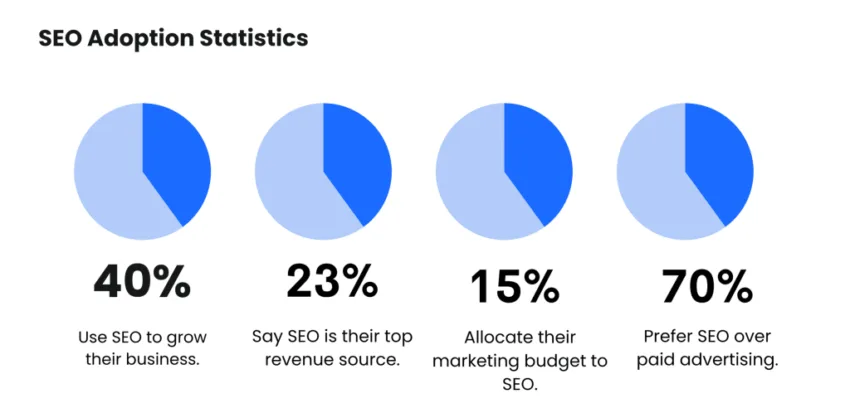
Here’s how I’d actually use the SEO statistics cluster in a meeting. Show the 68% search traffic figure, then show your own organic share, then show what happens to revenue if organic share rises a few points. That’s a three-slide story with a clear ask.
Pair it with a competitor gap analysis — the share of clicks your top rival captures versus yours on your priority keywords.
Your SEO statistics checklist for budget season should include market share data, competitor click share, and a conservative revenue model. Numbers alone don’t persuade; narrative plus numbers does.
Technical and Core Web Vitals SEO Statistics
Technical health stats are the least glamorous and the most underrated. Structuring your SEO statistics around proven patterns ensures impact. A slow, broken, or bloated site caps your ceiling no matter how good the content is.
The 25 Stats: Technical Performance
- A one-second delay in mobile load time correlates with a measurable drop in conversions. Site speed is a revenue variable, not a nice-to-have. Benchmark your key templates in PageSpeed Insights, then fix the single worst offender rather than micro-optimizing everything.
- Roughly 53% of mobile visits are abandoned when pages take longer than three seconds to load. Half your mobile audience is gone before your hero image finishes painting. Compress and preload your hero asset first; it’s usually the biggest single win.
- Bounce rates rise sharply as load time increases past three seconds. Slow pages don’t just lose rankings — they lose the reader mid-sentence. Install a real-user monitoring tool and track LCP by template, not by site average.
- Google’s own research indicates a significant share of pages fail Core Web Vitals assessments. Failing CWV isn’t a penalty, but it signals a site that’s hemorrhaging users. Treat it as a UX priority dressed in technical clothing.
- Over a quarter of websites run on a single major CMS platform, WordPress. Plugin bloat on common CMS platforms is the most frequent culprit behind poor CWV scores. Maintain a tight, audited plugin list.
- A large fraction of indexed URLs receive zero organic traffic. Crawl waste is real and financially costly. Run a quarterly index bloat audit — prune tag archives, parameterized duplicates, and thin category pages.
The fascinating thing about this cluster is how consistently people misread it. CWV failing doesn’t mean rankings tank tomorrow. It means your user experience is degrading, and Google’s systems are designed to reward pages users actually stick with.
Fix the UX, and the rankings follow as a side effect.
Turning Technical Stats Into a Roadmap
Build a prioritized list in the SEO statistics order: speed of your top-traffic templates, then CWV failures on priority pages, then index bloat, then everything else. Most teams get 80% of the benefit from the first two items.
For a deeper read on how Core Web Vitals are evaluated, the web.dev vitals documentation is the most authoritative reference available.
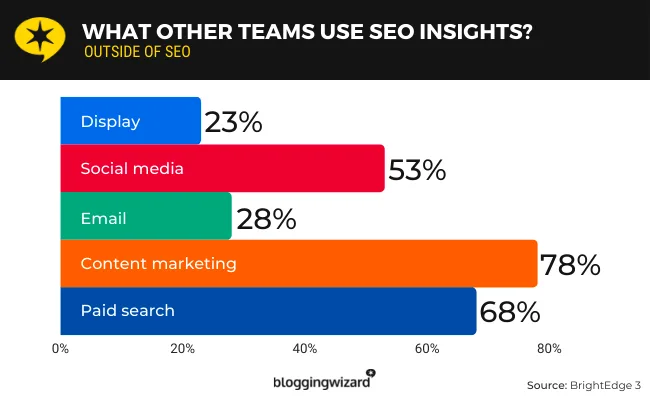
Fold these technical items into your SEO statistics best practices documentation so engineering and content teams share one source of truth.
Content, Keywords, and Ranking SEO Statistics
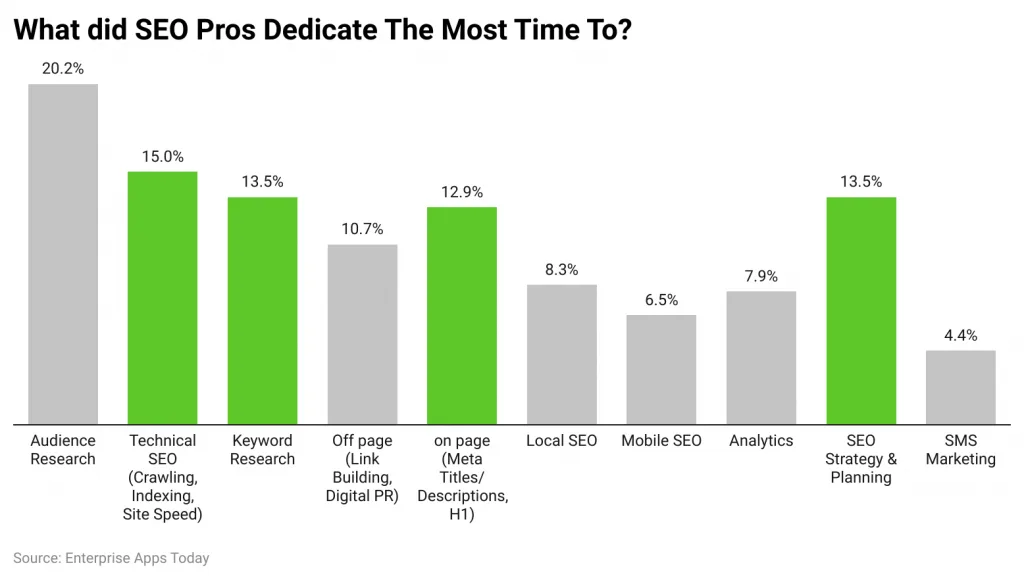
Content stats get the most attention and the most misinterpretation. Proper attention to your SEO statistics sets a strong baseline. Word counts, keyword density, and backlink correlations all get cited as laws when they’re really patterns.
The 25 Stats: Content and Ranking Signals
- Longer, comprehensive content consistently outperforms shorter pieces in ranking studies. Depth tends to correlate with ranking — though the mechanism is topical coverage, not word count itself. Write to answer every real question on the topic, not to hit a target.
- Pages ranked in the top three tend to average well north of 1,000 words in competitive niches. It’s a useful benchmark cushion, not a rule. A tightly argued 800-word answer will beat a padded 3,000-word one every time.
- Roughly 90% of pages receive no organic traffic from Google. The long tail is a long shadow. This stat should rewire how you set content expectations: most pieces are supporting actors, not stars.
- Content with a recent update timestamp performs measurably better on average. Freshness matters for ranking recovery. Schedule a two-year refresh cadence on every commercial page and quarterly on news-adjacent topics.
- Backlinks from authoritative domains remain one of the strongest ranking correlations in large-scale studies. Not causation proof, but correlation you cannot ignore. Prioritize earning links through original data, tools, and expert commentary over volume-driven link buying.
- A meaningful share of top-ranking pages for competitive keywords carry at least one featured snippet. Snippet capture is a parallel channel worth targeting explicitly. Structure FAQ content with direct, two-sentence answers right under a matching question heading.
- Approximately half of all searches generate zero clicks to external sites. Getting cited as the answer is worth as much as getting the visit. Optimize for winning the answer box, not just the blue link.
- Content with original research earns dramatically more links per piece than opinion content. If your content calendar doesn’t have a research-backed piece in it this quarter, you aren’t building linkable assets — you’re publishing commentary.
The pattern across this cluster: depth, freshness, and authority all compound. None of them rewards a sprint. Building a sustained publishing cadence with periodic refresh is the only path I’ve seen deliver predictable results.
If you only act on one stat here, act on the 90% no-traffic figure — because it forces honest conversations about content ROI.
Applying Content Stats Without Chasing Word Counts
Let’s put this into practice. The stat “longer content ranks better” gets cited constantly, and it’s a misleading shortcut.
What actually correlates with ranking is topical completeness — having every reasonable subtopic covered, the right entities mentioned, and real audience questions answered.
An SEO statistics guide that hits 34 stat entries with thorough context will outrank a 4,000-word article that meanders. Depth beats length.
Then use freshness as the multiplier: quarterly refresh on high-value pages, and a content decay monitor so you catch rankings sliding before revenue dips.
Conversion, Local, and Voice SEO Statistics
Rankings are the setup; conversions are the payoff. Developing your SEO statistics with precision highlights key strengths. This cluster covers what happens once users arrive — plus the local and voice behaviors that dictate how many arrive.
The 25 Stats: Conversion and Emerging Signals
- Organic search converts at a notably higher rate than paid channels on average. For ecommerce and SaaS, organic’s conversion rate advantage compounds its traffic advantage. Track organic-assisted revenue separately to surface this in reporting.
- A majority of marketers report organic search produces their highest ROI channel. When asked to rank channels on return, organic consistently comes out ahead. Use this when negotiating channel budget reallocations.
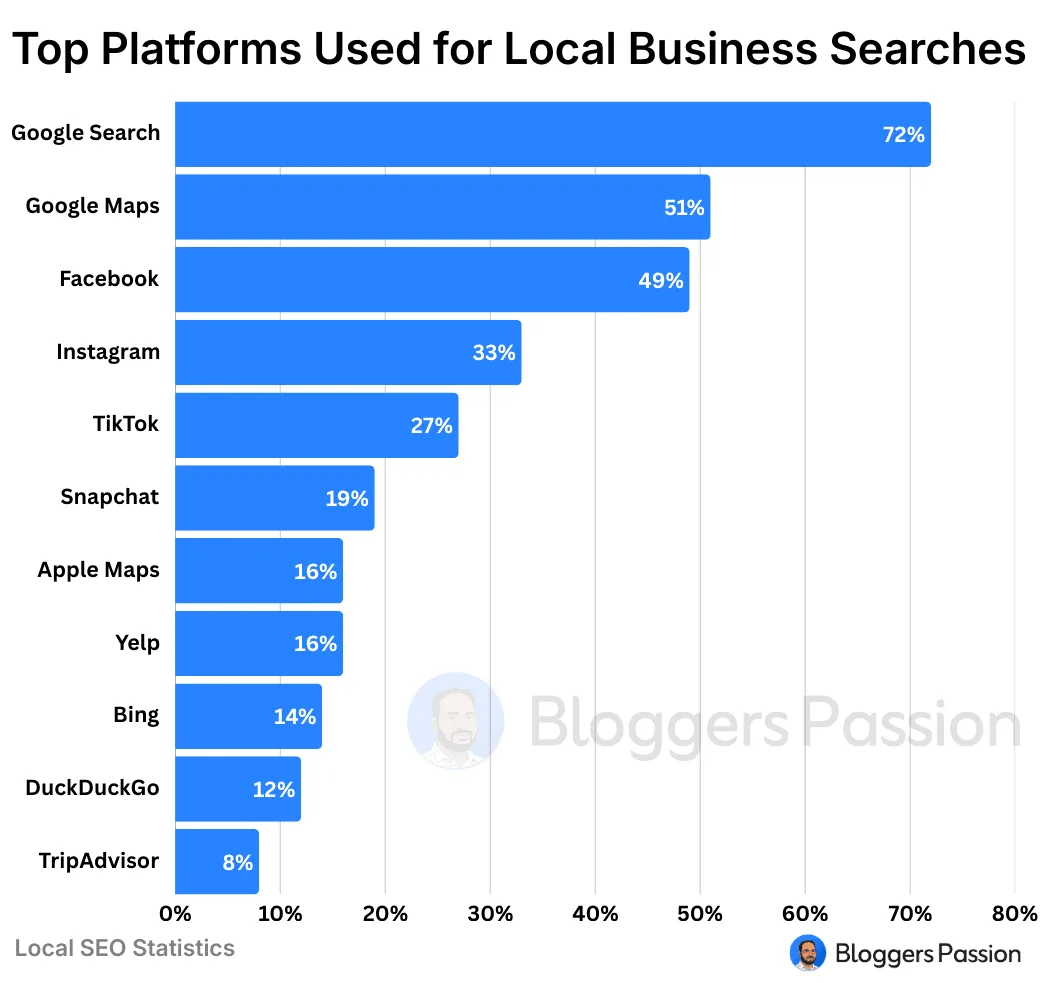
- Nearly half of all Google searches have local intent. Local SEO isn’t niche — it’s mainstream for service businesses. If your business serves a physical geography, optimize the local pack presence before your broader content plan.
- Roughly 42% of local intent searches result in the user contacting or visiting a business within 24 hours. Local search is high-intent, near-transactional behavior. Optimize for it with Google Business Profile completeness and NAP consistency.
- Voice search handles a meaningful and growing share of query volume via assistants. Voice-optimized content is largely just conversational, question-first content — a side benefit of good SEO practice generally.
- Over 90% of online experiences begin with a search engine. The odds a customer discovers you any other way first are small. This is the single cleanest framing for why SEO sits at the center of a discovery strategy.
- AI overviews and summaries increasingly appear on informational SERPs, affecting click patterns. Defensive response: build first-party data capture (newsletter, tool, community) as protection against SERP volatility.
| Stat Cluster | Headline Number | Primary Business Action |
|---|---|---|
| Click behavior | ~27% of clicks go to the top organic result | Prioritize advancing positions 2–5 before new content |
| Traffic economics | ~68% of trackable traffic comes from search | Reframe SEO as core strategy, not side channel |
| Technical health | ~53% of mobile users abandon after 3 seconds | Fix speed on top-traffic templates first |
| Content and ranking | ~90% of pages get zero organic traffic | Set realistic ROI expectations per content piece |
| Conversion and local | ~90% of online experiences begin with search | Anchor SEO at the center of discovery strategy |
Building a Data-Driven Conversion Argument
The trick with conversion stats is attribution. Focusing on seo statistics provides clear direction here. Last-click models systematically undercount organic, because customers research via search, then convert via email or brand recall later. Set up a proper multi-touch attribution model (or at least a Google Analytics 4 exploration) to see the real picture.
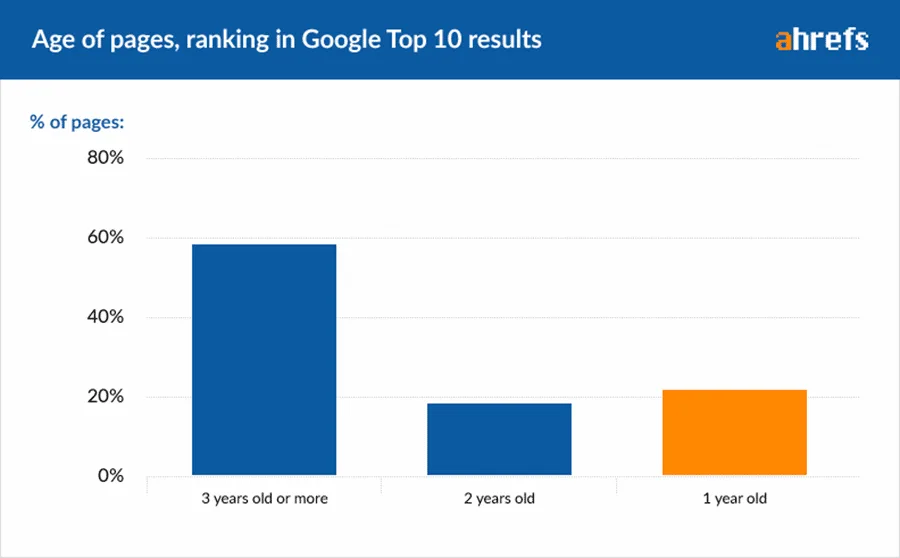
Once organic-attributed revenue is visible, the budget conversation changes completely.
Keep a small SEO statistics tips document on hand for these moments — the three or four stats that reframe the conversation in your favor.
The SEO Statistics Checklist You Actually Need
Twenty-five stats are useful in a pitch. But a working SEO statistics checklist is what turns insight into discipline. Here’s how to operationalize them.
The Monthly Health Check
- Export click-through rate by position for your top 50 queries and compare to the benchmark curve.
- Review Core Web Vitals failures on your five highest-traffic templates.
- Audit index bloat — how many of your indexed URLs received at least one click last month?
The SEO statistics monthly review is the compounding habit. It’s not dramatic, and it won’t win any awards, but six months of consistency catches problems while they’re still cheap.
The Quarterly Strategic Review
- Competitor click share: are you gaining or losing ground on your ten priority keyword clusters?
- Content decay: which pages lost more than 20% of their organic sessions quarter-over-quarter?
- Channel ROI re-check: is organic still returning more per dollar than your alternate channels?
Quarterly is where the market economics stats earn their keep. It’s also where you decide which old pages to retire — a page that hasn’t earned a single click in a year is a liability, not an asset.
The Annual Authority Review
Once a year, step back and audit the domain’s positioning as a whole. Integrating SEO statistics into your workflow produces consistent quality. This is where the long-view top-level stats — the 90% search-start figure, the channel ROI rankings — guide bigger structural decisions.
Ask hard questions. Refining each detail of your seo statistics strengthens this section. Are you the recognized authority on your topic, or are you producing content that’s identical to fifty others?
If decay and click share both trend the wrong direction, the annual review is where you decide to consolidate, prune, or rebuild. SEO statistics best practices don’t just track momentum — they tell you when to change direction entirely.
How to Avoid the Stat Trap
Here’s the uncomfortable truth I’ve learned the hard way: stats are persuasive, but the SEO statistics’re not always accurate. Every figure in this list comes from a study with methodology limits — sample bias, vertical specificity, and the general unreliability of correlational research.
So use stats to open doors and light the way, but make every decision with your own data. A click rate benchmark is a conversation starter; your Search Console is the conversation.
Pairs of complementary data — one industry stat plus one first-party number — is the most defensible configuration for any argument you’ll make.
The good news: the direction all 25 of these stats point is consistent. Prioritize clicks, speed, depth, authority, freshness. Do that and you’re in the top decile of the industry regardless of how the benchmarks shift.
Keep the SEO statistics guide current, revisit the checklist each month, and let the numbers argue for you.