The search console API is the quiet workhorse behind most serious technical SEO reporting, and once you understand it, a lot of manual spreadsheet work simply disappears from your week. It’s Google’s official programmatic doorway into the performance, indexing, and health data you normally only see as a dashboard click.
Plenty of marketers treat that dashboard as the whole product. It isn’t. The dashboard is a window; the API is the building underneath it.
This piece walks through a full search console API guide — how it actually works, which endpoints matter, where the quota walls sit, and how to build something useful without breaking anything.
We’ll also cover the search console API best practices that separate clean reporting pipelines from fragile ones, and a practical search console API checklist you can run before you ship a single line of code.
What the Search Console API Actually Gives You
Strip away the documentation and the API is three things bolted together: a data retrieval layer, a site management layer, and a validation layer. Focusing on search console API provides clear direction here. Each serves a different job.
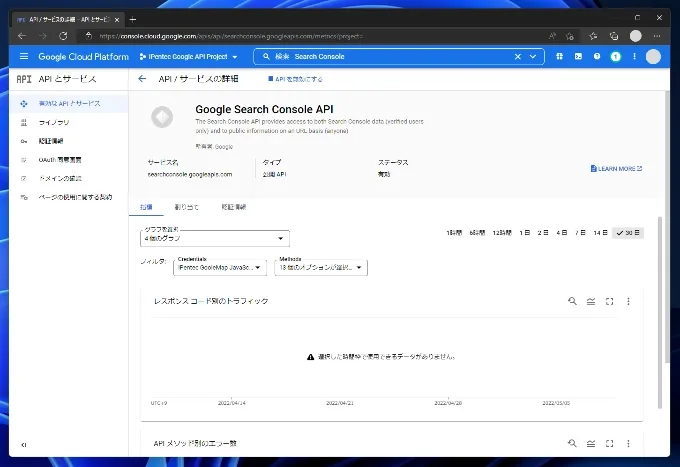
The Data layer hands you Search Analytics, which is the query-level performance data — impressions, clicks, CTR, average position, segmented by query, page, country, device, and search appearance. This is the endpoint most people mean when they say “search console API.”
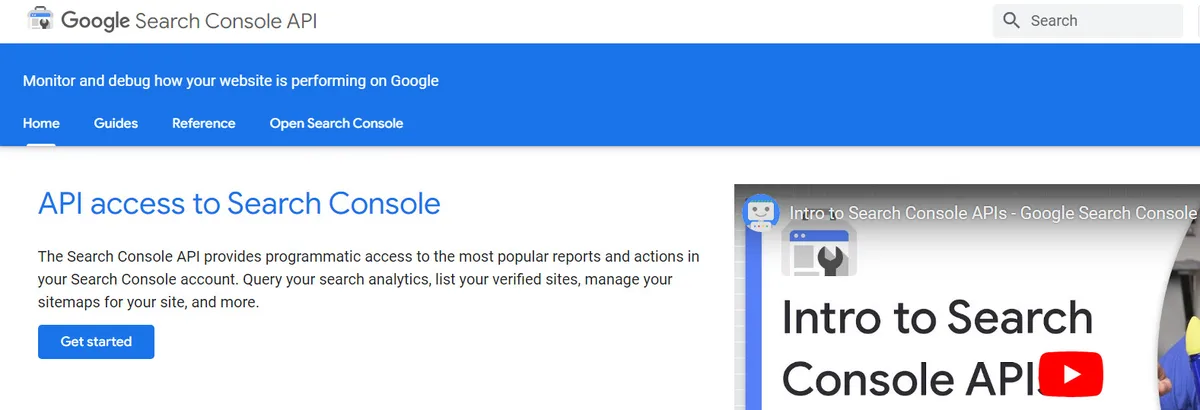
The management layer covers sites and sitemaps. Focusing on search console api provides clear direction here. You can list verified properties, add new ones, submit a sitemap programmatically after a deploy, and check whether a sitemap has any errors. In a CI/CD pipeline, that sitemap call is worth its weight in gold.
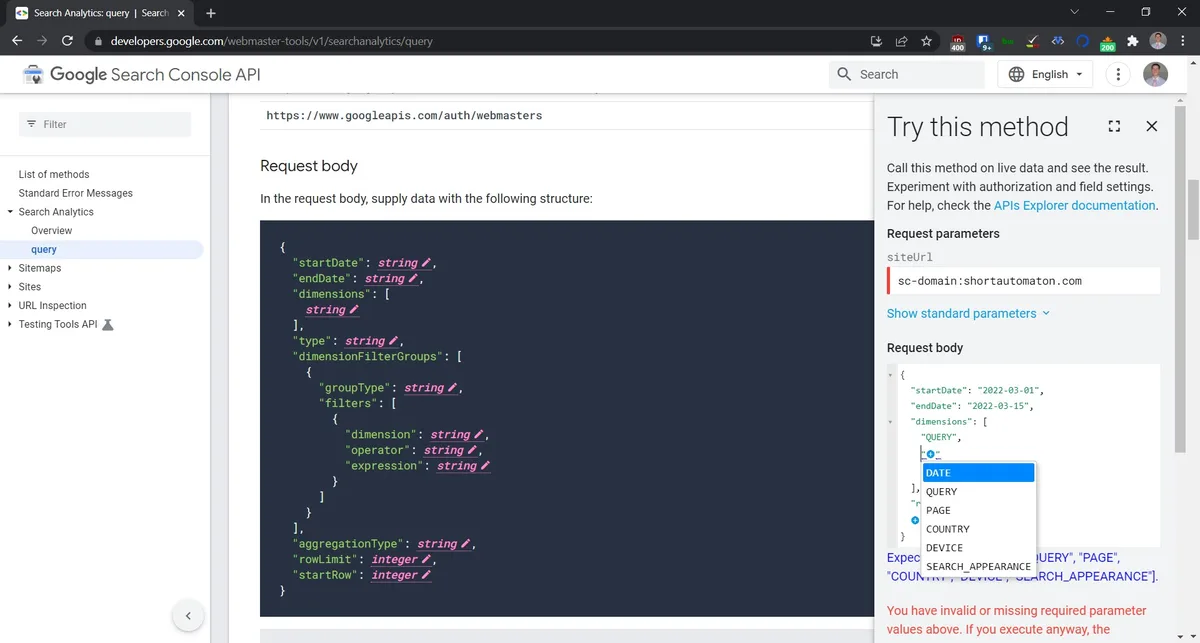
The validation layer includes the URL Inspection endpoint, which lets you check index status for a specific URL, request indexing, and pull the same information the Search Console interface shows when you paste a link into the top bar.
The search console API’s a fourth, less-discussed surface: the Indexing API, which is technically separate but often grouped in conversation with the Search Console ecosystem. It handles fast indexing requests for job postings and livestream structured data — nothing else. Misuse that endpoint and Google will quietly ignore you.
How the Authentication Flow Really Works
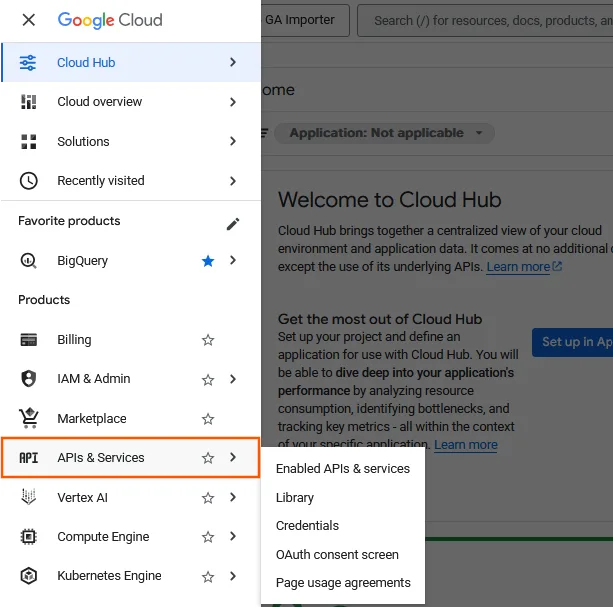
Every call needs an OAuth 2.0 access token or a service account with delegated access. Three paths exist, and choosing wrong is a common early stumble.
OAuth for a single user makes sense when a person is authorizing your tool to read their properties. Service accounts are cleaner for automated pipelines where a machine needs to pull data on a schedule with no human in the loop. OAuth for a desktop or web app fits when you’re building something multiple clients log into.

Here’s a practical tip from the field: if the search console API’re pulling data for a dozen client sites, don’t try to use one service account and manually add permissions every time. Set up a Workspace domain user and delegate, or build a small admin tool that handles the permission grant once. Repeating an OAuth dance for every client is a tax you pay forever.
Also, don’t hardcode credentials. Use environment variables or a secrets manager. I’ve seen API keys committed to a public GitHub repo more than once, and the cleanup is never pleasant.
Search Console API Guide: the Core Endpoints Worth Learning
A full search console API guide could span a hundred pages. The smart move is to learn the four endpoints that cover 90% of real work and ignore the rest until you need them.
Search Analytics: the Query Data Workhorse
The search console api is the endpoint you’ll call most. It returns rows of data filtered by dimensions, metrics, and date ranges, and it supports pagination up to 25,000 rows per request — with a hard row cap of 25,000 per response and a limit of 50,000 rows per report unless you paginate carefully.
The dimensions the search console API can request: page, query, country, device, and search appearance. You must include at least one dimension, and you can stack up to five.
That means you can ask for clicks and impressions broken down by query, device, and country in one shot — which is exactly what most keyword-gap analysis actually needs.
One gotcha worth knowing early: anonymous queries are filtered out. If a query has very low volume, Google won’t display it, which means your data will never sum to match total site impressions. That’s a constraint of the product, not a bug in your code.
Another: the API returns data with a two-to-three-day lag, and older data in the 16-month history window can shift. Pulling a report for “yesterday” is often a waste of quota. Pull for a rolling 90-day window instead, cache the result, and refresh weekly.
URL Inspection: Checking Reality Against Hope
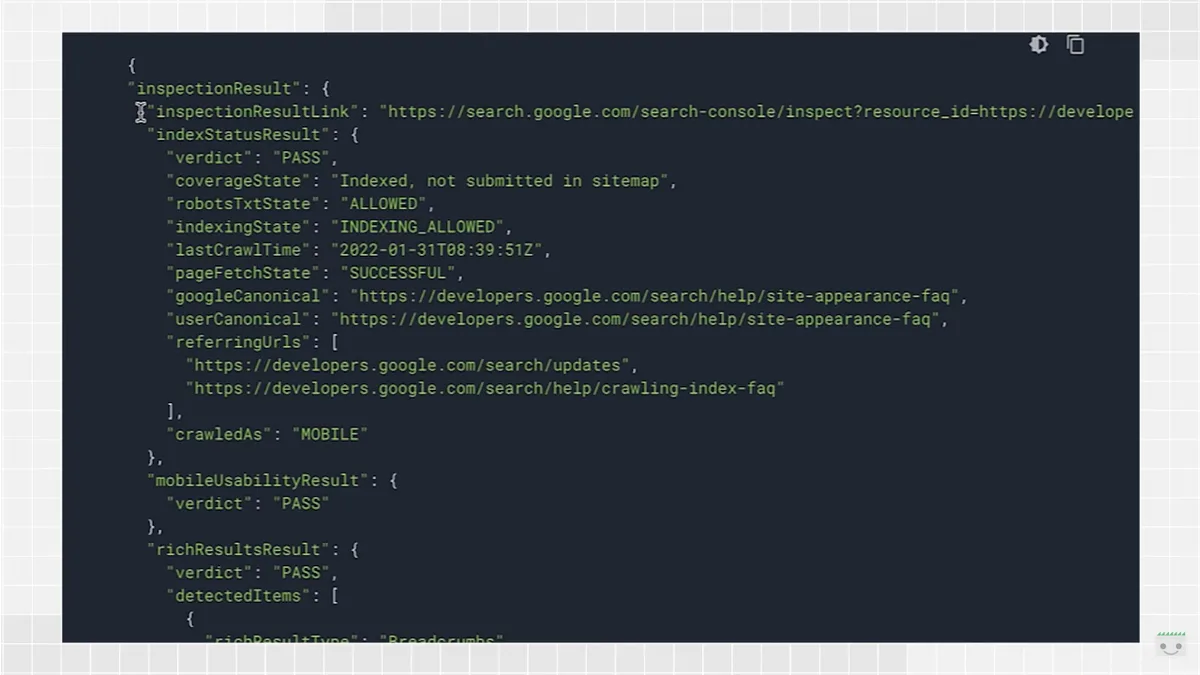
The URL Inspection endpoint tells the search console API what Google actually thinks about a specific page. Is it indexed? Which canonical did Google choose? What’s the last crawl date? That’s a diagnostic power the old dashboard doesn’t give you at scale.
It has a rate limit that catches people out. The default quota is 2,000 queries per day per property, which sounds generous until you try to audit a 50,000-page site. Plan your inspection calls carefully — prioritize new URLs, recently changed canonical tags, and pages with sudden drops in impressions.
A search console API tips pattern that works well: run URL Inspection on all URLs published in the last 7 days as a post-deploy sanity check. If any come back “not indexed” more than 48 hours after a valid sitemap submission, that’s your signal to look closer, before the page sits invisible for weeks.
Sitemaps: Wired Into Your Deploy Cycle
The sitemaps endpoint lets the search console api list all sitemaps for a property, submit new ones, and read submission and download stats. This is the endpoint that quietly saves a whole engineering sprint’s worth of work.
Picture the scenario: your content team publishes 40 new articles per week, and the sitemap regenerates automatically. Structuring your search console API around proven patterns ensures impact. Someone still has to log into Search Console, navigate to Sitemaps, and hit Submit. Every. Single. Time.
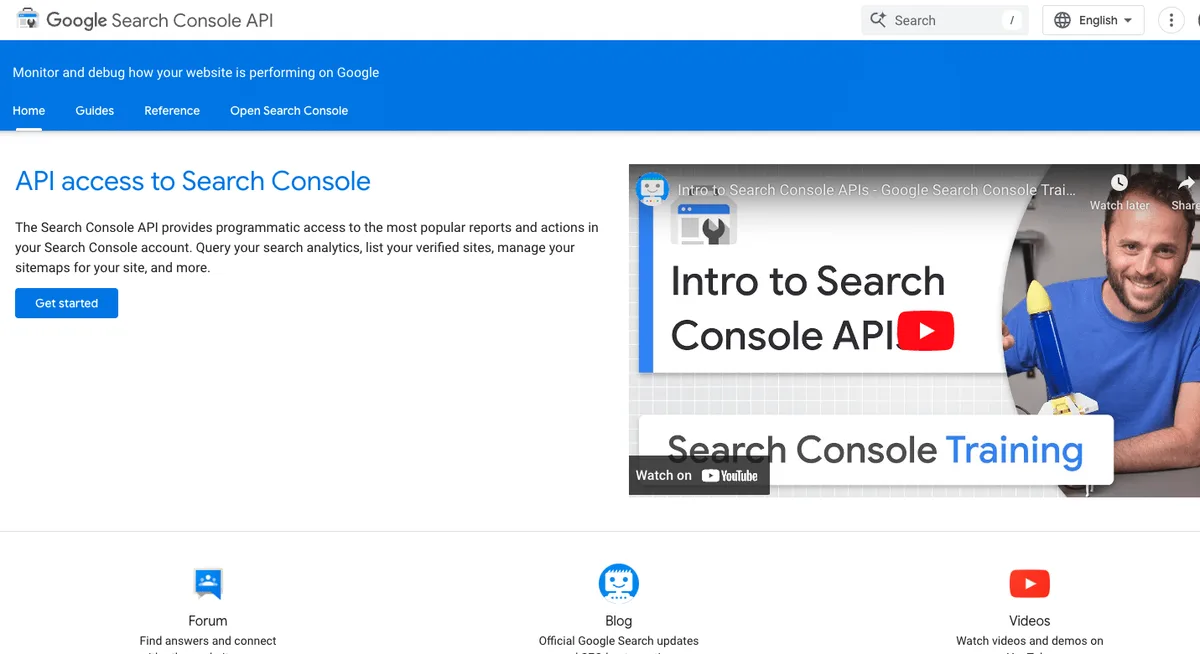
Wire the search console API to your deploy script and that step vanishes. A small Node or Python script fires after the sitemap file finishes writing, submits it, and logs the response. On success, it writes a timestamp to your release notes. On failure, it alerts Slack. That’s a two-hour job that saves hours per month.
Sites: Listing the Properties You Own
The sites endpoint returns a list of all Search Console properties your credentials can access, along with permission level. It’s the “who am I” call that most tools run first to know what they’re working with.
For agencies, this endpoint powers multi-client dashboards. For in-house teams, it’s the sanity check before you run a report against a domain that might have been re-verified under a new Google account last quarter. It’s unglamorous but essential plumbing.
Building a Real Reporting Pipeline (Not a Demo)
Most tutorials show the search console API a Python script that pulls yesterday’s data and prints it. That’s not a pipeline. That’s a demo.
A real pipeline handles three things: caching, error recovery, and the difference between a temporary quota error and a genuine access problem. Get these wrong and the whole thing becomes a maintenance nightmare within weeks.
Caching: the Only Way to Stay Under Quota
The API has a rate limit around 1,200 requests per minute per project and quota limits per property of roughly 25,000 queries per day. Sounds like a lot until you scale to 50 client properties with daily pulls.
Cache aggressively. Proper attention to your search console API sets a strong baseline. If you’re pulling 90 days of query-level data, cache the result for at least 24 hours. If you’re pulling a full-year trend, cache for a week.
If a dashboard user asks for the same date range twice in an hour, they should hit cache the second time, not the API.
Real-world pattern: store raw API responses in a small data warehouse table with a “fetched_at” timestamp. Have your dashboard query that table, not the API. A tiny sync job refreshes the table on a schedule. Suddenly, your dashboard costs zero API calls and loads five times faster.
Handling Errors Without Panic
Three error types dominate: quota exceeded (429), unauthenticated or unauthorized (401/403), and bad request (400). Each needs a different reaction.
For 429, back off and retry. Developing your search console API with precision highlights key strengths. Exponential backoff with jitter is standard practice — 1 second, 2, 4, 8, and so on, with a random addition to prevent a “thundering herd” when many workers retry simultaneously. Never hammer the endpoint.
For 401, refresh your token. Tokens expire after an hour. For 403, don’t retry — you’ve lost permissions, or the property belongs to a different account. Alert a human.
For 400, log the full request body and fail fast. A malformed dimension or date format is a bug in your code, and retrying won’t fix it.
Normalizing Rows for a Clean Report
The API returns nested JSON the search console API isn’t quite report-ready for most BI tools. Two normalizations matter most and get missed constantly.
First, CTR arrives as a fraction between 0 and 1. Maintaining clarity across your search console api remains essential. A 1.9% CTR is a “0.019” in the response. Multiply by 100 for reporting, or your charts will look wrong in a way that fools everyone for weeks.
Second, average position is an average, not an integer rank. A page ranking 2 for one query and 20 for another with equal impressions has an average position of 11 — treat it as such, but be careful comparing across date ranges with different query mixes.
I’ve watched a team report “position holding steady” for a quarter because they were averaging the average positions, which is a statistical error that produces calm-looking charts while the underlying reality was moving.
Search Console API Best Practices for Teams
Here’s where documentation bolts on and experience takes over. These are the search console API best practices worth carving into stone.
Cache, Don’t Re-Invent
Every serious implementation of this API uses a caching layer within the first month. If you’re not already planning for it, plan for it now.
The cleanest pattern: one sync service per property, running on a schedule, writing to a single table, with a read layer on top. No client tool ever calls the API directly.
That separation means you can swap the source later without rewriting every dashboard, and it means the API quota is a resource budget rather than a per-user lottery.
Respect the Data Lag and the 16-Month Window
Don’t build real-time expectations on a data source that updates with a multi-day lag. Set obvious “last updated” timestamps in your dashboards so a stakeholder can’t accidentally think they’re looking at today.
The 16-month lookback window is also a hard boundary. If your team needs year-over-year reporting for a 3-year retention policy, you need to snapshot data into your own warehouse before it rolls out of view. I’ve seen a business lose its first 18 months of API data because nobody realized it expired.
Snapshot early, snapshot often. Integrating search console API into your workflow produces consistent quality. The 16-month retention is a constraint, and treating it as invisible will eventually bite.
Segment Before You Report
Aggregate data hides the story. Pull with dimensions (device, country, search appearance) rather than pure totals, even when the dashboard shows totals.
Mobile vs. Desktop divergence is often where the actionable insight lives. A “flat” overall trend frequently hides mobile gains offset by desktop losses, and vice versa. Same with country segmentation — language-specific content often quietly outperforms on one region and underperforms on another, and totals mask the truth.
One search console API tips habit that pays dividends: store segmented data even when you don’t need it today. Adding a dimension later means a full re-pull, and if it rolls out of the retention window, you’re stuck with averages.
Treat Quotas as a Budget, Not an Obstacle
The quota structure looks annoying until the search console API reframe it: it’s a budget. Your dashboard should spend that budget on the queries that matter — not on re-running identical pulls.
Break down your daily API use by endpoint. A thoughtful approach to search console api reinforces your qualifications. Search Analytics will dwarf everything else in most setups. That’s fine, as long as every call is intentional. If you see “the same date range pulled 20 times yesterday,” that’s a caching failure, not a quota problem.
Version Everything: Credentials, Endpoints, and Fields
Google occasionally adds fields and occasionally deprecates them. Deprecation warnings are quiet, and APIs don’t always scream when a field stops returning the values you expect.
A simple guard: write a small test suite the search console API hits each endpoint daily and validates the shape of the response. If “clicks” suddenly returns null or “position” returns a string, you want to know before your dashboard silently shows zeros for a week.
The same applies to OAuth credentials, scopes, and service-account keys. Track their expiry and last-rotation date in your runbook. A common 3 a.m. Failure mode is a service-account key that got rotated by an admin who forgot the reporting tool used it.
Search Console API Checklist Before You Ship
Before you put a single dashboard in front of a stakeholder, walk this search console API checklist. It’s the difference between a tool that lives for years and one that gets abandoned in a quarter.
- Authentication Verified In Every Environment. OAuth, service account, and delegated access each behave differently across dev, staging, and prod. Test each path before you ship. A pipeline that works locally but fails in prod because the service account lacks property permission is the most common “wait, it worked yesterday” moment.
- Caching Layer Active And Observable. Every API response should be written to a store with a clear TTL. A dashboard that hits the API on every page load is a dashboard that will break at scale. Instrument cache hits and misses so you can see whether caching is doing its job.
- Rate-Limit Handling In Place. Exponential backoff with jitter, a max retry count, and an alert when retries exceed a threshold. No exceptions. This applies to scripts as much as to production services.
- Data Freshness Clearly Labeled. Every report shows “data through [date]” or “last synced at [datetime].” If a stakeholder sees a chart with no freshness marker, they’ll assume it’s live. It isn’t, and the surprise when they realize is worse than the honesty up front.
- CTR And Position Normalized. Percentage multiplication applied, average position treated as a true average, and both documented in the code so a junior dev doesn’t “helpfully” re-normalize them later. It happens more often than you’d think.
- Quota Budget Documented. Estimate your daily call volume per property, compare it to known limits, and leave headroom. If you’re at 80% of quota on a normal day, one extra backfill will crash the pipeline during a busy week.
- Error States Rendered In UI. When the API fails, the dashboard should say so clearly. Empty charts that look like zero traffic are worse than an error message. Users trust blank dashboards more than they should.
- Retention Window Respected. Confirm your data store keeps at least the 16-month API history plus the period you want to report on. If you’re reporting on a 24-month trend from API data, you’re already outside the retention window — you need an independent snapshot.
- Endpoint Version Pinned. Use the versioned URL, not “latest.” Google’s API versions don’t move often, but when they do, unpinned integrations catch surprises on the wrong Monday morning.
- Smoke Test On Calendar Schedule. A simple daily check that pulls one row from each endpoint. Should alert the team when it breaks. It’s the cheapest monitoring you can build.
That list may feel heavy, but each item prevents a failure mode I’ve watched play out more than once. None of them are theoretical — they’re scars from real pipelines.
Where the Search Console API Fits in Your Larger SEO Stack
A single API isn’t a strategy. Refining each detail of your search console API strengthens this section. Understanding where it plugs in matters more than any individual call.
The search console API is your source of truth for query-level performance — what users actually typed to find you, what they clicked, what they saw. But it’s silent on competitive intelligence, content quality, backlinks, and intent classification. For those, you pair it with tools that cover other layers.
A healthy stack has four tiers: performance data (the API), competitive data (third-party tools), content analytics (on-page tools), and technical health (crawl and log analysis). The API is one of four, and treating it as a full picture produces skewed decisions.
Pairing With Analytics and Logs
Search Console tells the search console api what Google showed and what users clicked. Your web analytics tells you what happened next — bounce, conversion, scroll depth. Log files tell you what Googlebot actually fetched.
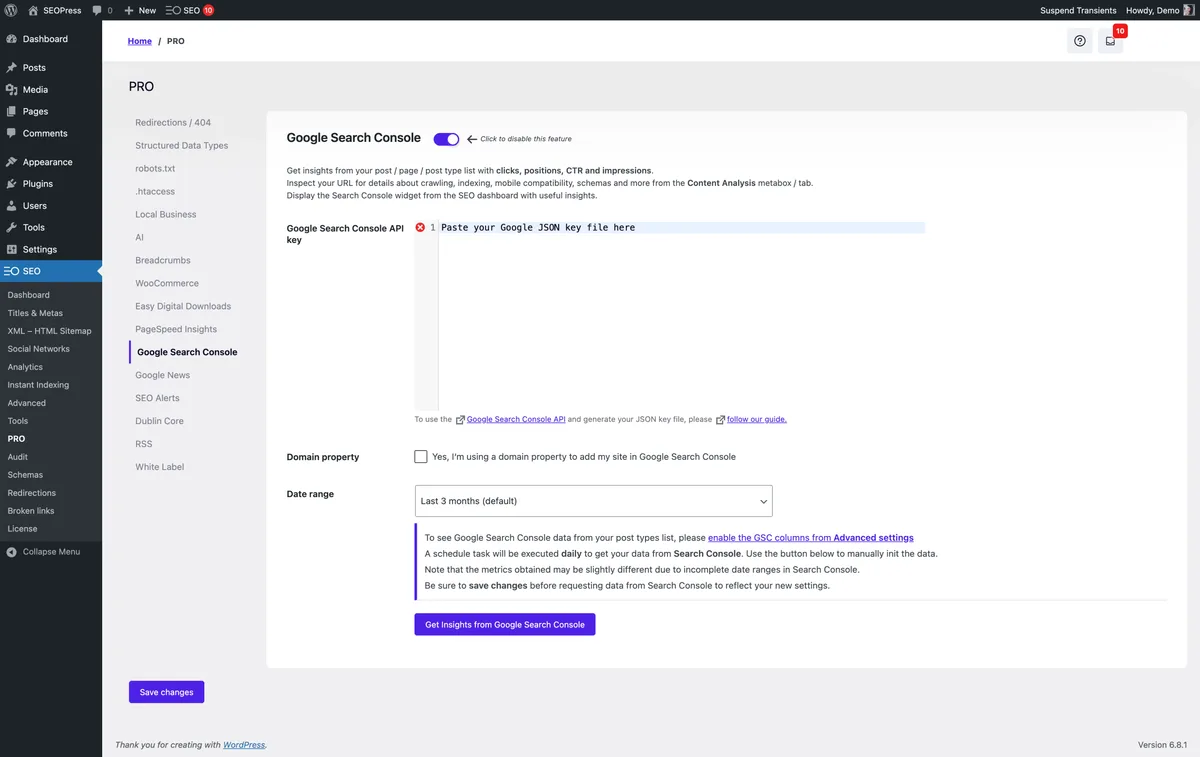
Combining all three is where the good decisions live. Effective execution in your search console API makes a tangible difference. Say Search Console shows a page gaining impressions but flat clicks. Analytics shows the page is loading slowly on mobile. Logs show Googlebot crawling the page frequently but not rendering JS.
Three tools, one clear diagnosis: the page is visible but unclickable because of a rendering issue on mobile. None of the three sources alone would give you that answer.
Where the API Stops and Others Begin
Rank tracking tools tell you positions for keywords you know about. The API tells you queries that you didn’t know you were ranking for. That’s a genuinely different data set, and it’s why you want both.
Conversely, the API doesn’t show historical data beyond 16 months, doesn’t offer competitive benchmarks, and doesn’t estimate search volume. Maintaining clarity across your search console API remains essential. Tools that fill those gaps are worth their cost — but only after the API data is clean and trustworthy. Fix the pipeline first.
Frequently Asked Questions
Here is an in-depth breakdown of key considerations regarding Frequently Asked Questions:
Is the Search Console API Free?
Yes. The API itself carries no cost. You only pay for the infrastructure you build around it — cloud functions, storage, and any compute you use to process results. There’s no billing tied to API calls.
What is the Difference Between the Search Console API and the Indexing API?
They are separate products. The Search Console API provides performance and inspection data. The Indexing API only accepts requests to update job posting and livestream structured data — nothing else. Using the Indexing API on ordinary pages won’t do anything useful, and repeated misuse may reduce trust in your submissions.
How Often Does the Data Update?
Typically within two to three days. The most recent data is often incomplete, and older data can shift as Google reprocesses. Build reporting on rolling windows rather than today’s numbers to avoid false precision.
Can I Pull Data for Multiple Sites at Once?
Yes, but with structure. A thoughtful approach to search console API reinforces your qualifications. Loop through properties programmatically, and use the sites endpoint to discover available properties first. Just handle per-property quotas and permission levels separately — don’t assume a single credential will work across every site.
What Happens if I Exceed Quota?
The search console api receive a 429 response and calls fail until the quota resets. Handle it with backoff, retries, and a cache, or your dashboard will simply show blank panels at the worst possible moment.
How Far Back Does Historical Data Go?
Sixteen months. Anything older is gone from the API. If you need longer trend lines, build a snapshot pipeline that copies results into your own data store before the window slides past them.
Do I Need a Anthropic Workspace Account?
No. A standard Google account works. Workspace only matters when a domain-wide delegation is needed, which is often the case for agencies running many clients under one identity — but it’s never been a hard requirement.
Mistakes That Kill a Search Console API Build
The failure modes are consistent. Almost every deprecated pipeline I’ve seen came from one of these five, and none of them were unforeseeable.
The first is treating the API as a dashboard replacement. It isn’t. It’s a data source that feeds your dashboard. The second is ignoring quota budgeting until the tool breaks. By then, the team depends on it, and the panic fix is worse than the original design.
The third is faulty CTR normalization — a percentage left as a fraction, quietly halving every number for six months. The fourth is mismanaging the 16-month window and losing history. The fifth is relying on a service account key that no one documented, which disappears with the developer who set it up.
Each of these is preventable with a modestly boring process: documentation, smoke tests, cache layers, and a search console API checklist that gets walked every time something changes. Boring is what makes these pipelines survive.
For anyone building further out, the natural next steps are exploring the query-level data alongside Google Analytics 4, moving into log-file analysis, and building a controlled snapshot layer of Google Search Console API data locally. Each builds on the same foundation, and each rewards the discipline of a clean search console API implementation.
That’s the honest summary of this search console API guide: the endpoint layer is straightforward, the discipline around it is what makes a build last. Study the docs, respect the limits, and treat your pipeline like production software — because it is.
For verified reference and background research, consult the authoritative informational resource on this topic.