Positioning mapping gives you a visual read on how buyers actually sort your brand against the competition, and it turns that messy mental picture into a decision tool you can act on.
If you’ve ever argued with a teammate about whether your product feels “premium” or “affordable” and walked away with nobody convinced, this is the framework that ends that argument with a picture instead of a shouting match.
What follows isn’t a skim-the-surface overview. Focusing on positioning mapping provides clear direction here. It’s the full working method: how to define the right axes, where to source honest data, how to plot competitors without fooling yourself, and how to translate the finished chart into pricing, messaging, and product calls.
You’ll also get three worked examples across different industries, a template you can copy, and the traps that make most brand maps useless.
What Positioning Mapping Actually is (And What It Isn’t)
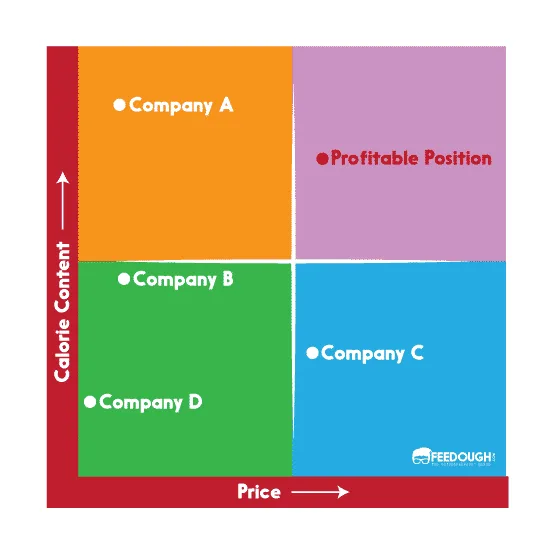
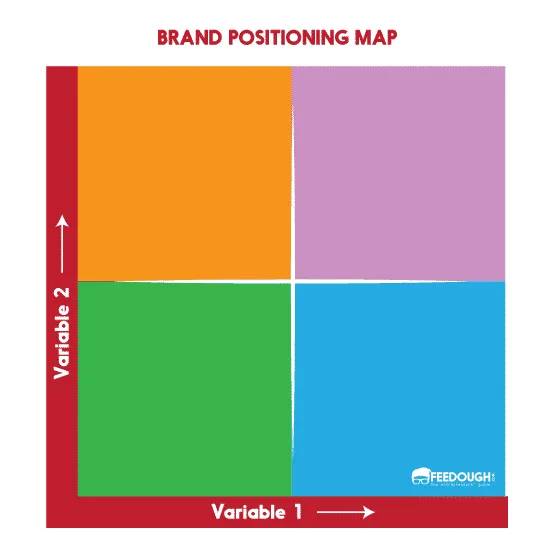
Strip away the jargon and a positioning map is a two-axis grid where brands occupy spots based on how customers perceive them on attributes that matter to a purchase decision. Refining each detail of your positioning mapping strengthens this section.
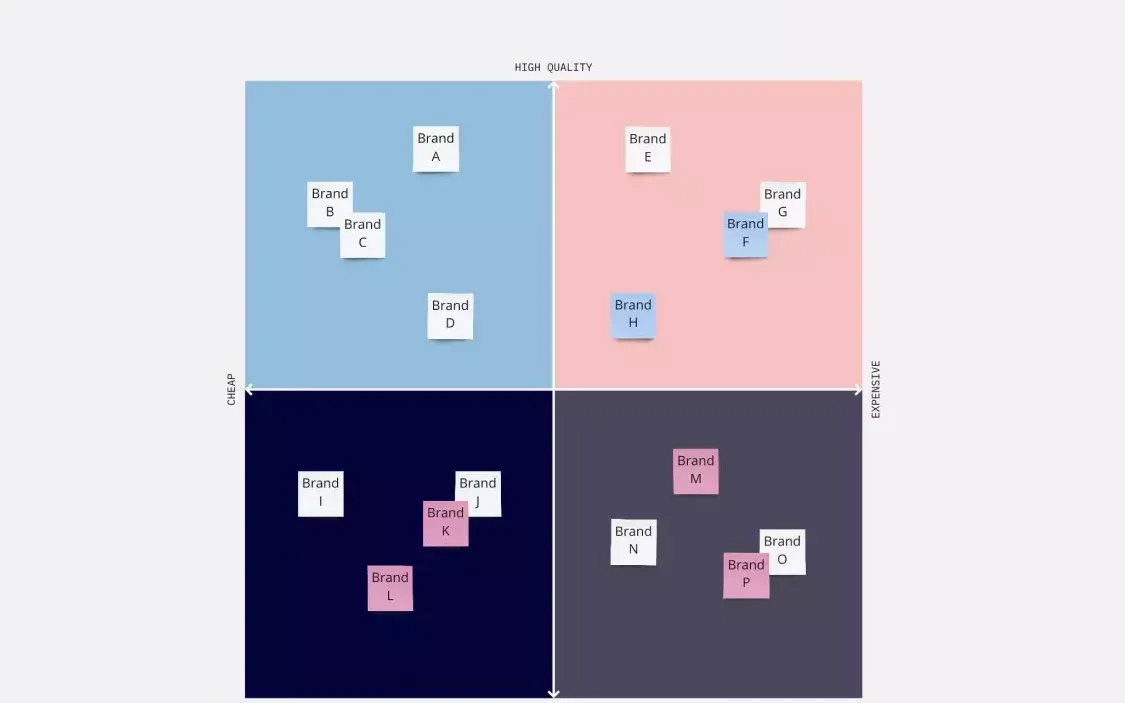
Price versus quality is the classic pair, but the interesting work happens when you pick axes that reflect the real tension in your category. A positioning map done well shows clusters, gaps, and crowded corners at a glance.
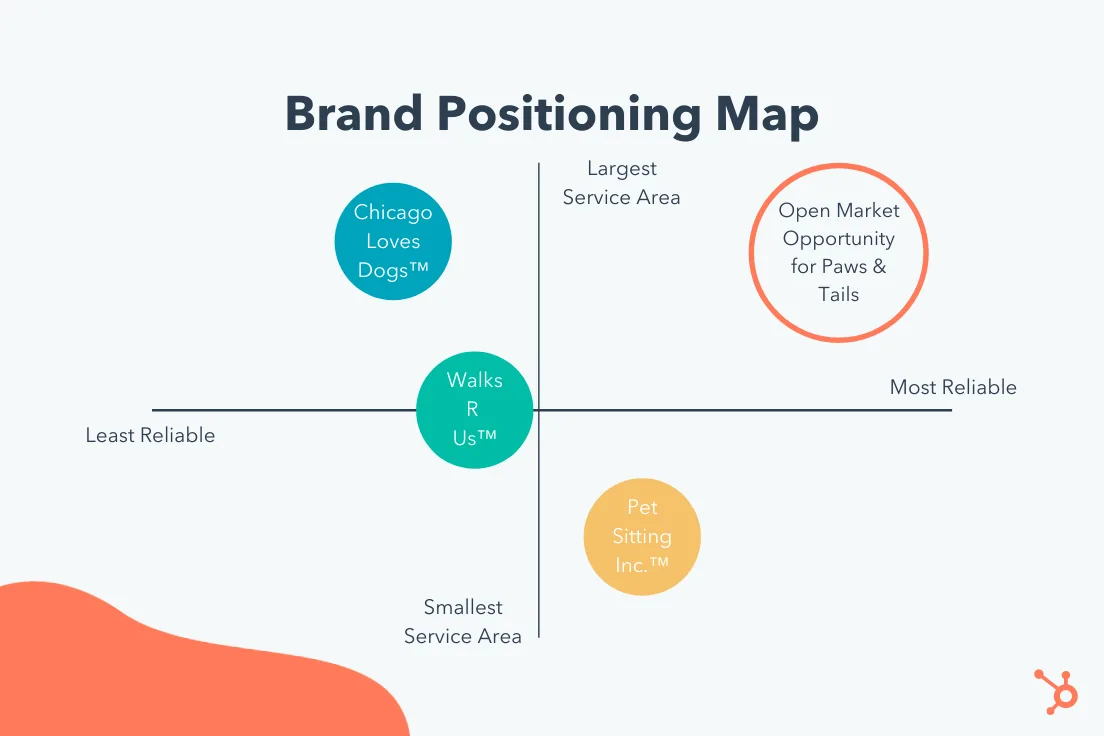
Here’s the part people get wrong: it is not a slide you make once and frame on the wall. It’s a living diagnostic. When a competitor drops their prices or a new entrant reframes the whole conversation, the map should shift. Treat it as a recurring checkpoint rather than a one-time deliverable, and it stays useful for years.
Think of positioning mapping as a conversation accelerator. In workshops I’ve run, the value rarely comes from the final image. It comes from the ten minutes where three people point at the same empty quadrant and realize they’ve each been imagining a different audience. The chart just makes the disagreement visible.
The Difference Between a Positioning Map and a Perceptual Map
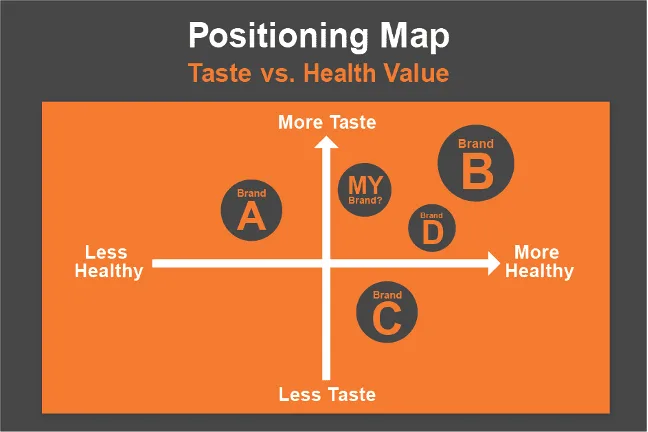
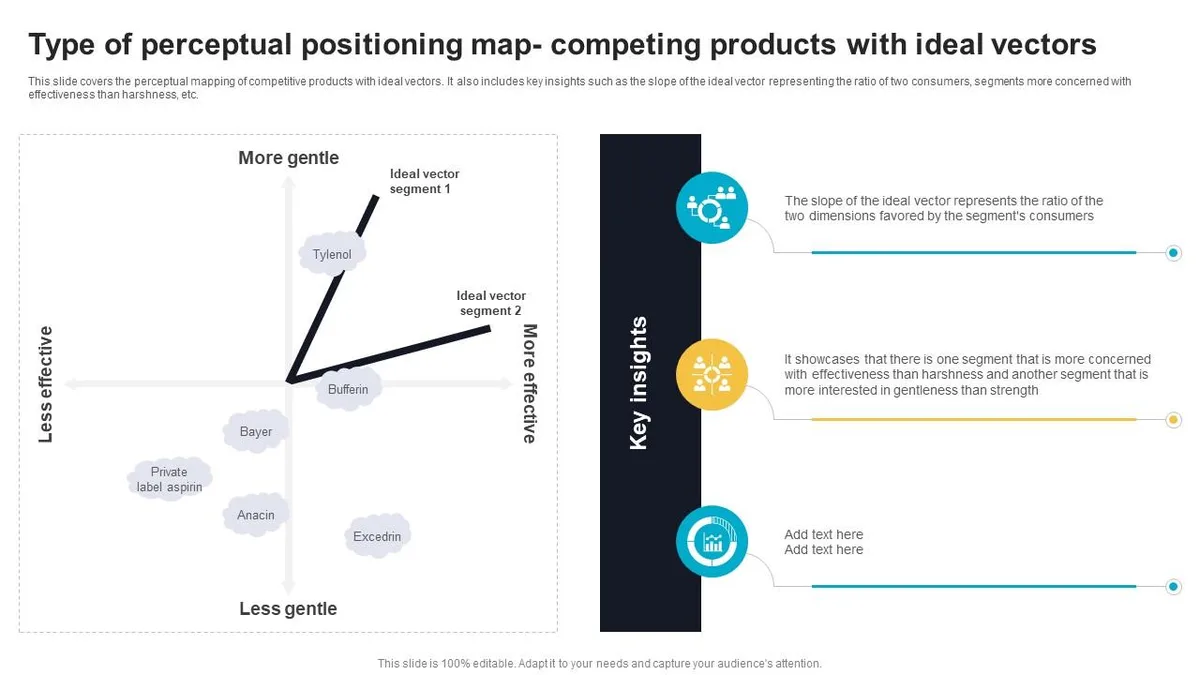
Practitioners use these terms almost interchangeably, and honestly, the distinction is thin. Perceptual mapping tends to focus on how customers perceive a brand emotionally and functionally, while positioning mapping leans toward the strategic question of where you want to sit and why. Same grid, slightly different intent.
In day-to-day work, I don’t bother policing the vocabulary. Effective execution in your positioning mapping makes a tangible difference. What matters is whether the exercise forces clarity. If your grid helps a founder articulate why they’re not competing on price, it did its job regardless of what you call it.
Why Every Brand Strategy Needs a Positioning Map
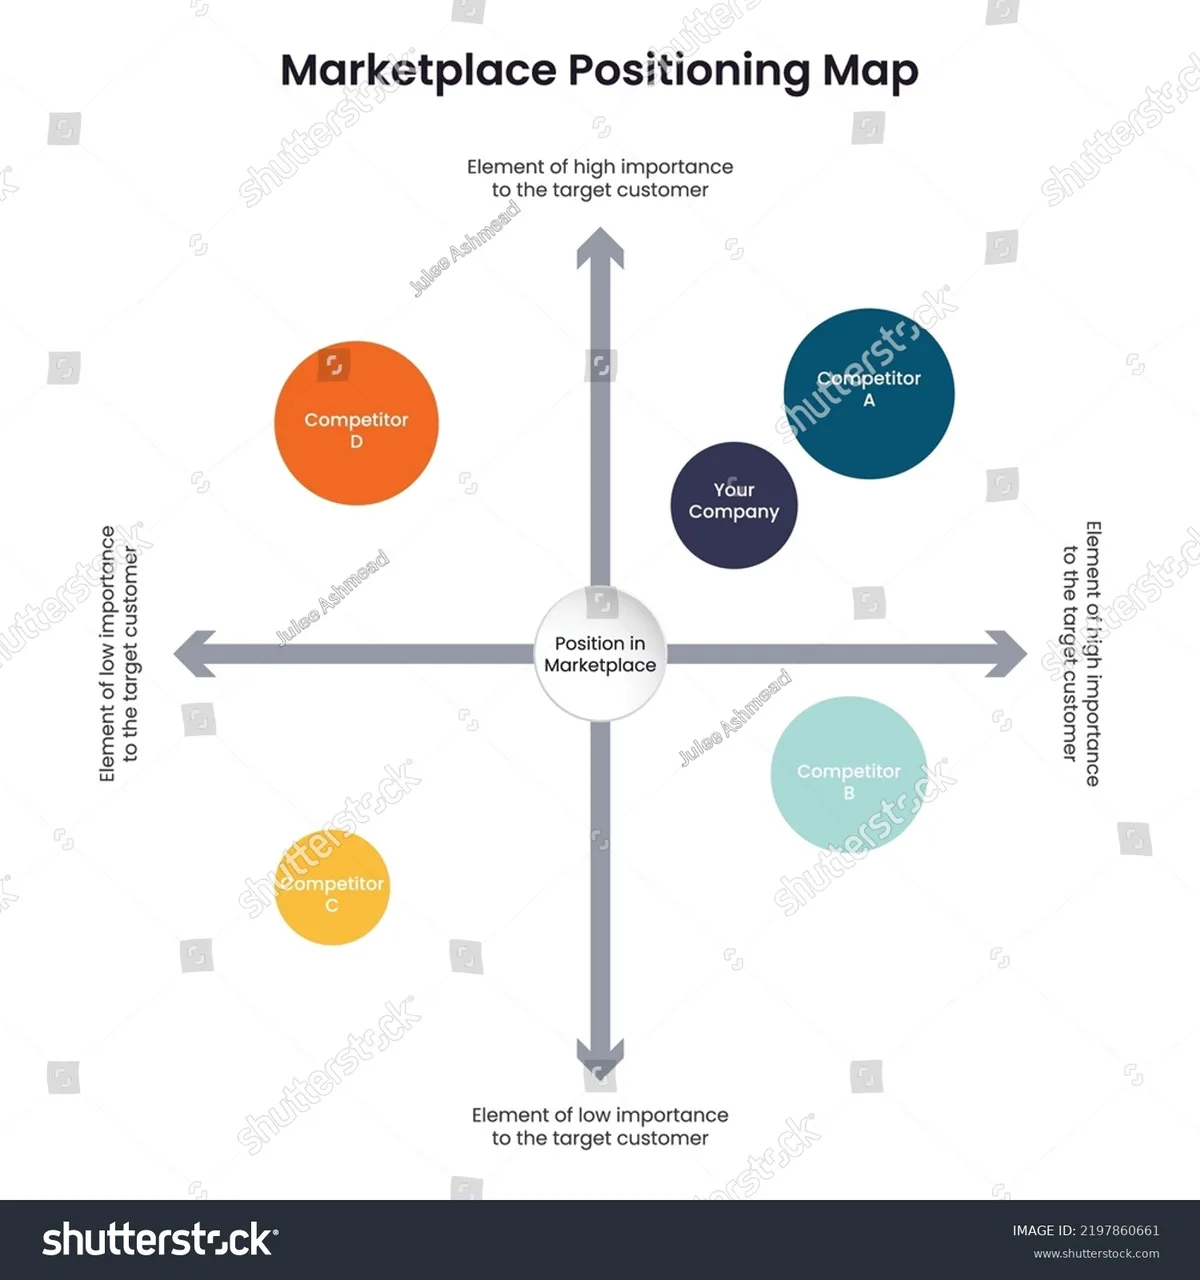
Without a map, positioning becomes a feeling. Teams drift toward “premium but approachable” or “innovative yet trusted” because those phrases sound safe, and then they launch with messaging that could describe any of five competitors.
Positioning mapping breaks that pattern by forcing you to place your claims on a measurable spectrum and defend them with evidence.
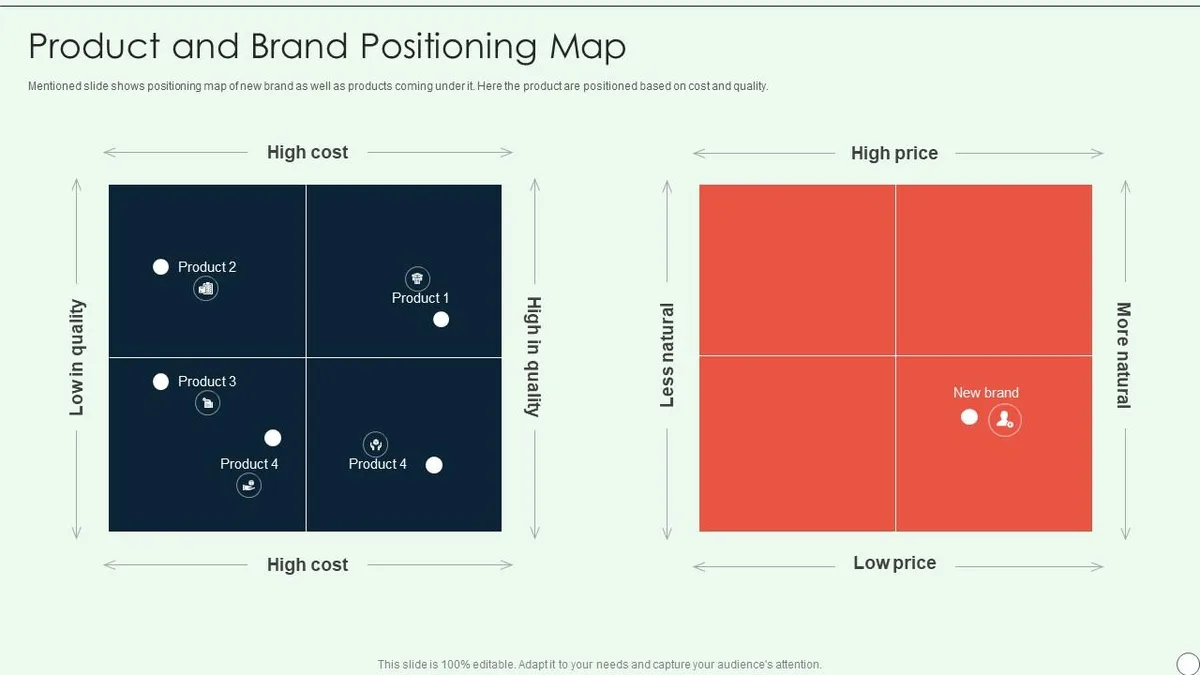
The second benefit is prioritization. Maintaining clarity across your positioning mapping remains essential. A good map reveals where the market is saturated and where demand exists but nobody has claimed the ground.
That gap doesn’t automatically mean opportunity — sometimes it’s empty because nobody wants that product — but it gives you a concrete hypothesis to test instead of a vague ambition.
There’s a third, quieter payoff. Positioning mapping aligns internal teams. Sales, product, and marketing often hold different mental models of where the brand sits. The moment those models land on the same grid, arguments about copy and pricing usually shrink fast, because everyone is finally looking at the same terrain.
How to Build Your First Positioning Map Step by Step
The process is more disciplined than it looks. Skip a step and the map turns into guesswork dressed as analysis. The sequence below is the one that holds up under scrutiny when you present it to skeptical leadership.
- Define The Decision You’re Informing — Every map should answer one question: a pricing move, a repositioning, a new segment entry, or a messaging refresh. A map built for a repricing decision uses different axes than one built to choose a target audience. Write the question down before anything else.
- Choose Two Axes That Carry Real Weight — Pick attributes buyers genuinely weigh during a purchase, not attributes your team finds intellectually interesting. Test each axis by asking: would a customer switch brands based on this difference? If not, discard it.
- Gather Perception Data — Source from customer interviews, win-loss calls, review mining, and short surveys. Hunches are allowed as a starting hypothesis but should be labeled as such until data catches up.
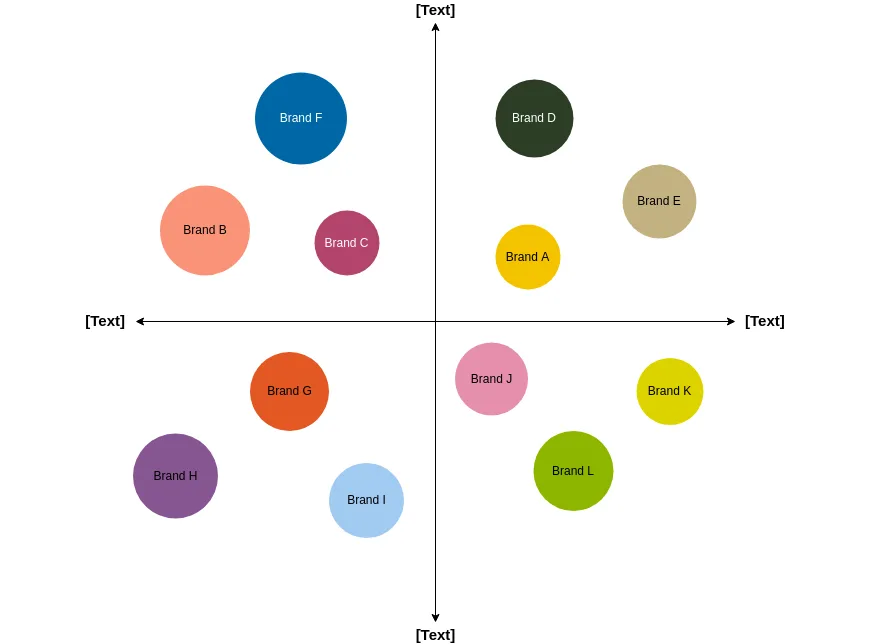
- Plot Your Brand And Every Serious Competitor — Aim for five to eight players. Fewer makes the market look emptier than it is; more creates noise. Include at least one adjacent player who could enter your space.
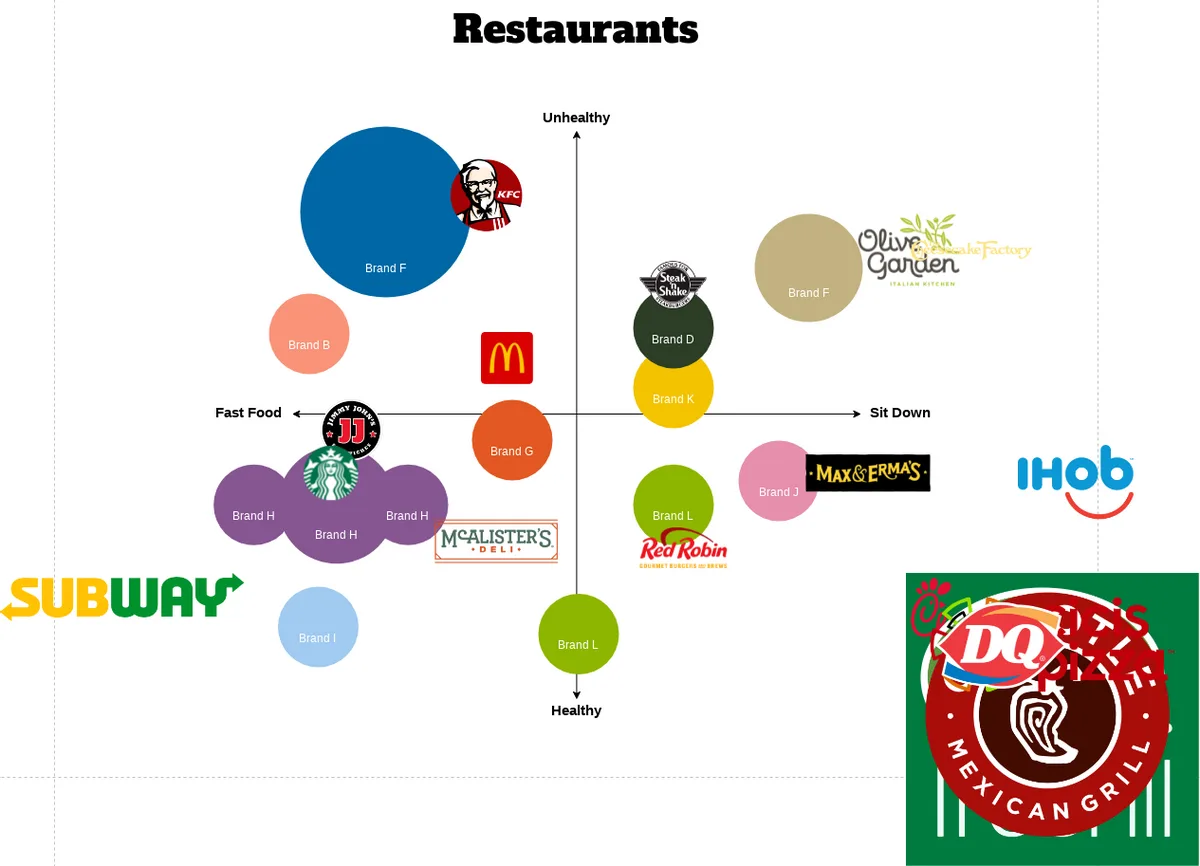
- Look For Clusters, Gaps, And Overlaps — Clusters signal commoditization. Gaps raise the question of unmet demand versus weak demand. Overlaps with a stronger competitor mean you need sharper differentiation.
- Decide Where You Want To Sit — Desired position is a strategic choice, not a description of where you currently are. Mark both, current and target, so the distance between them is visible.
- Translate The Map Into Actions — Positioning mapping only creates value when it changes something: a price, a headline, a feature roadmap, or a channel decision. End every session with a short list of concrete moves.
Choosing the Right Axes for Your Category
Axis selection is where most attempts collapse. A thoughtful approach to positioning mapping reinforces your qualifications. Price and quality work fine for commodity categories, but they flatten nuance in software or services. Better alternatives include ease of setup versus depth of control, self-serve versus high-touch, or speed versus configurability.
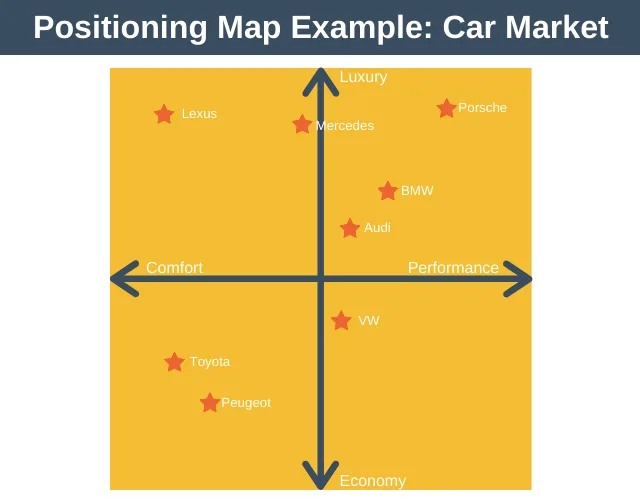
A practical trick: list twenty attributes customers mention in reviews, then cluster them into pairs that pull against each other. If customers rarely trade one for the other, it’s a weak axis pair. Strong axes create tension — buyers feel forced to choose, and that tension is exactly what makes the map informative.
You can also swap in emotional axes, such as traditional versus modern or playful versus serious. Structuring your positioning mapping around proven patterns ensures impact. Use them sparingly and pair them with a functional axis so the map stays grounded in reality rather than vibes.
Data Sources That Make Your Map Honest
Bad inputs, bad map. Positioning mapping is only as credible as the perception data underneath it. The good news is that you don’t need a six-figure research budget. Most organizations already sit on useful signals and simply never compile them.
Start with customer interviews, especially win-loss conversations. Ask not just why someone bought but who else they considered and why those options lost. These stories cluster fast into patterns that translate directly onto an axis. Review mining works similarly — pull three hundred reviews from your competitors and tag recurring phrases, then count frequency.
| Data Source | What It Reveals | Effort | Best For |
|---|---|---|---|
| Win-loss interviews | Real trade-offs buyers weigh | Medium | Axis validation, differentiation gaps |
| Review mining | Recurring language and complaints | Low | Axis discovery at scale |
| Short customer surveys | Quantified perception scores | Low | Validating axis positions |
| Sales team interviews | Objections and competitor intel | Low | Filling gaps fast |
| Social listening | Unprompted sentiment | Medium | Emotional axis calibration |
The combining step matters. Positioning mapping gets sharper when you triangulate — a survey tells you how widespread a perception is, while interviews tell you why it exists. Numbers without narrative produce a pretty chart that is hard to act on; narrative without numbers produces arguments that never resolve.
Three Worked Examples Across Different Sectors
Abstract advice is cheap. Seeing positioning mapping applied to real market dynamics is what makes the method click. Each example below uses a different axis pair, and each ends with a different strategic conclusion.
Example: a Coffee Roaster Competing Against Giants
Say you run a specialty roaster. Applying these principles to your positioning mapping yields measurable results. Axis one is roast consistency from experimentation to reliability; axis two runs from accessible to connoisseur. Plotting the market reveals a crowd in the reliable-and-accessible corner — grocery brands — and a small cluster in experimentation-and-connoisseur territory.
The empty middle, reliable and connoisseur, turned out to be the winning spot. A subscription product promising consistent, high-grade beans without the fuss of chasing roasts every month sat there. Positioning mapping made that gap legible and gave the founder language for pricing well above grocery prices.
Example: B2B Software in a Crowded Category
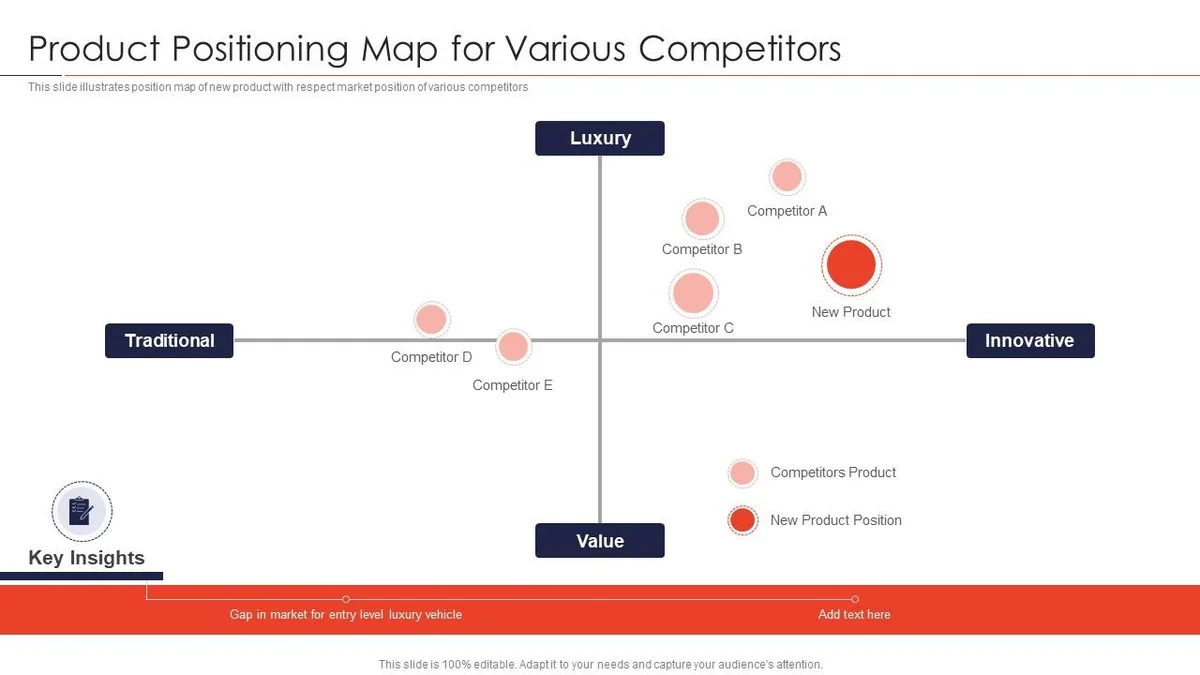
Picture project management software. Price versus features is a dead axis here because every player claims to have everything. A more useful pair: setup complexity versus customization depth. Most competitors cluster around either simple-and-shallow or deep-and-painful.
That leaves a genuine opening for fast setup with meaningful depth. A product sitting there can charge a premium and win deals without a feature arms race. Running this positioning mapping exercise also revealed an adjacent threat: enterprise players drifting downmarket toward simple setups, which forced a roadmap decision.
Example: a Regional Food Brand Considering Expansion
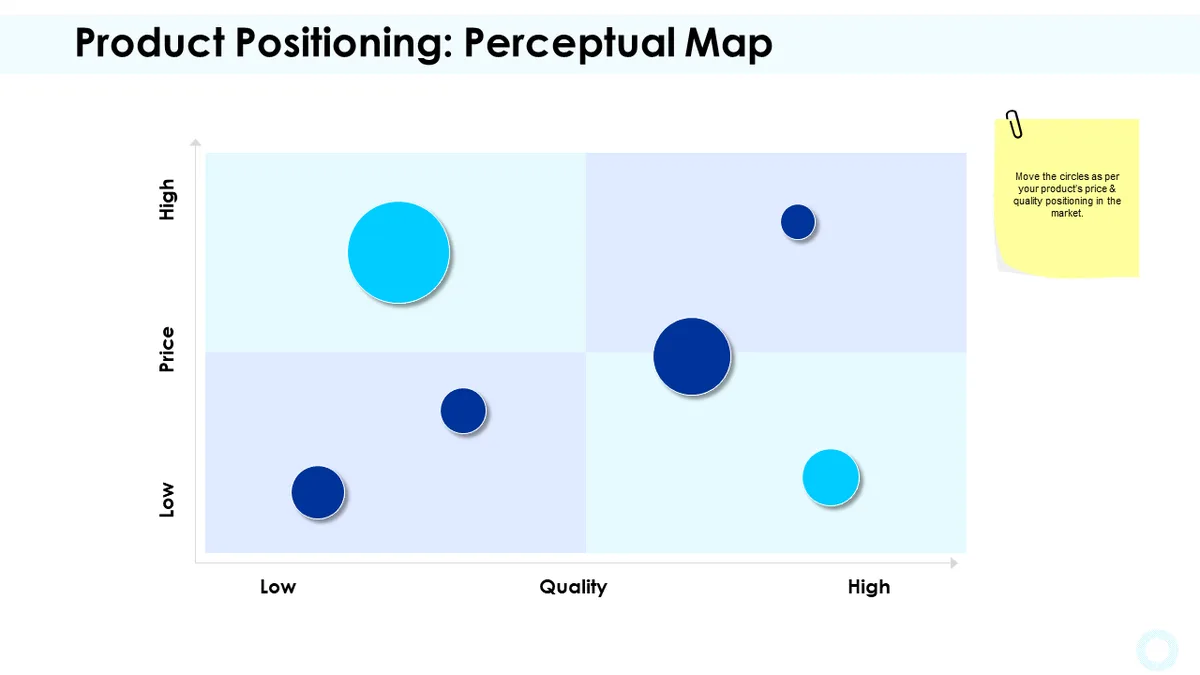
Now a local food brand with strong regional loyalty. Proper attention to your positioning mapping sets a strong baseline. Axis one is heritage-based versus modern; axis two is everyday versus occasion. National players cluster heavily in modern-and-everyday, leaving a pocket of heritage-and-occasion that a regional brand can credibly own.
That finding reframed the expansion plan entirely. Instead of fighting on supermarket shelf space, the brand targeted gifting and celebrations where heritage is a strength rather than a curiosity. A completed positioning mapping session can shift where budgets go within weeks.
Reading the Grid: Clusters, Gaps, and White Space
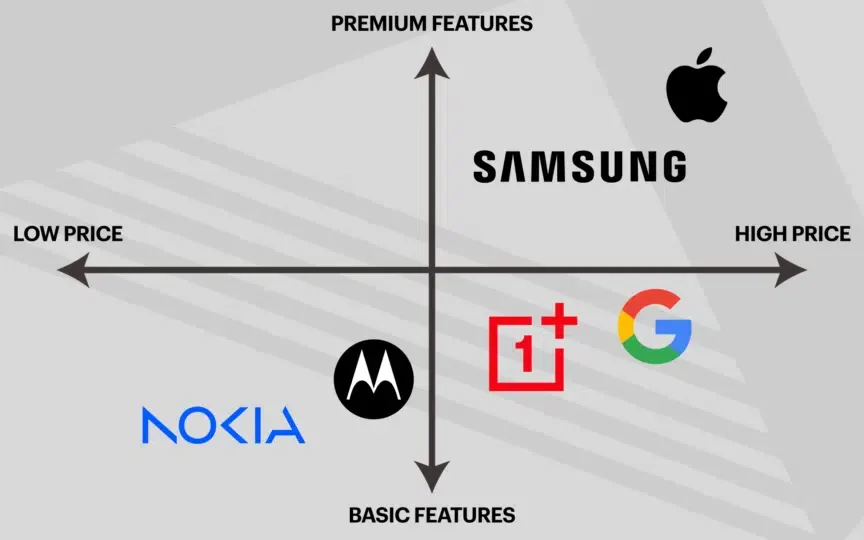
Once the points are placed, the analysis is a specific skill. The instinct is to hunt for white space immediately, but clusters deserve attention first. A dense cluster tells you where demand exists; you just need an angle to stand out rather than an entirely new patch of territory.
Empty areas demand skepticism. Developing your positioning mapping with precision highlights key strengths. Sometimes the gap exists because of unmet demand, and sometimes because nobody wants that combination badly enough to pay. Run a quick validation before committing — five customer conversations can usually settle whether a gap is real opportunity or a mirage.
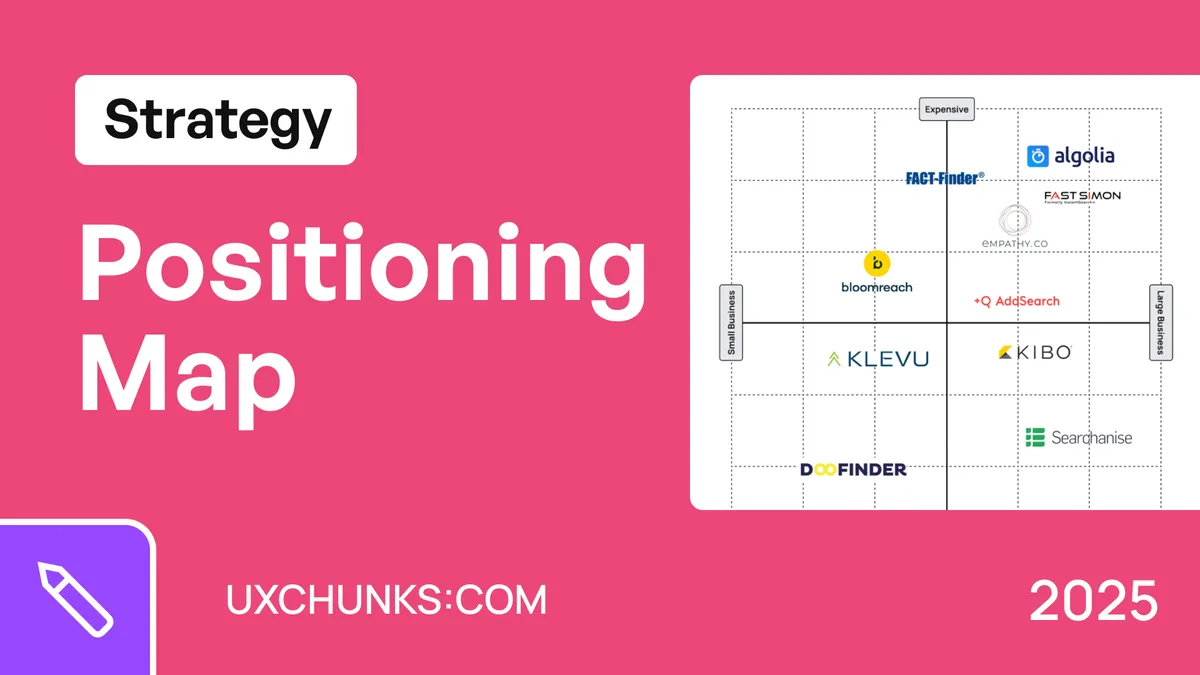
There’s a subtlety with overlaps. If your dot lands near a much larger competitor, positioning mapping should trigger a hard question: what makes a buyer pick you when they reach for the obvious name? If the answer is fuzzy, the map is warning you about a problem that copywriting alone won’t fix.
Translating the Map Into Messaging, Pricing, and Roadmap
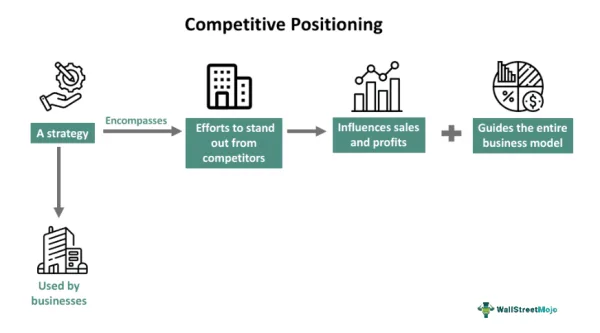
A chart that never leaves the chart changes nothing. The real work begins when you convert spatial insights into decisions. Positioning mapping becomes powerful the moment it dictates specific actions rather than summarizing the status quo.
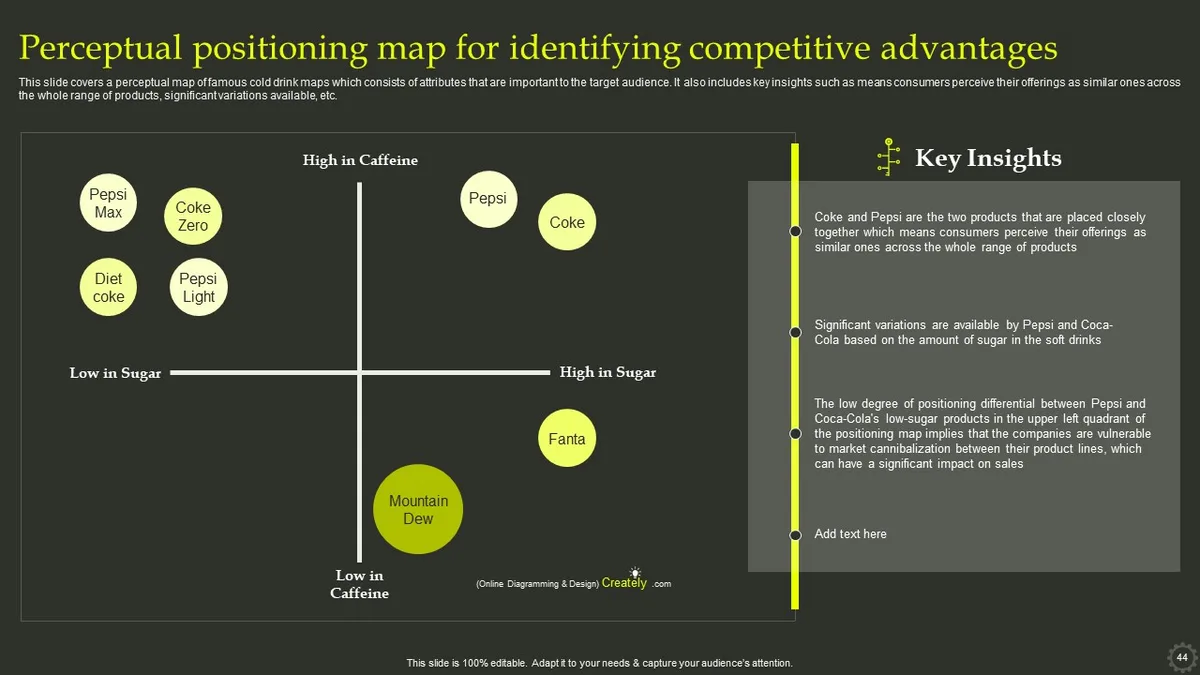
On messaging, every claim should reinforce the axis position. If you’ve chosen the reliable-and-expert corner, the copy should obsess over consistency and results, not novelty. On pricing, the axis position sets the anchor: sitting high on a premium axis while charging low confuses buyers and invites suspicion. On the roadmap, the chosen position tells you which features to build and which to skip.
Here’s where teams get lazy. They finish the positioning mapping workshop, nod at the insights, then go back to the same deck from last quarter. A simple forcing mechanism fixes this: every planning cycle, revisit the map and ask whether current priorities move you toward the target position. If they don’t, either the position or the priorities need to change.
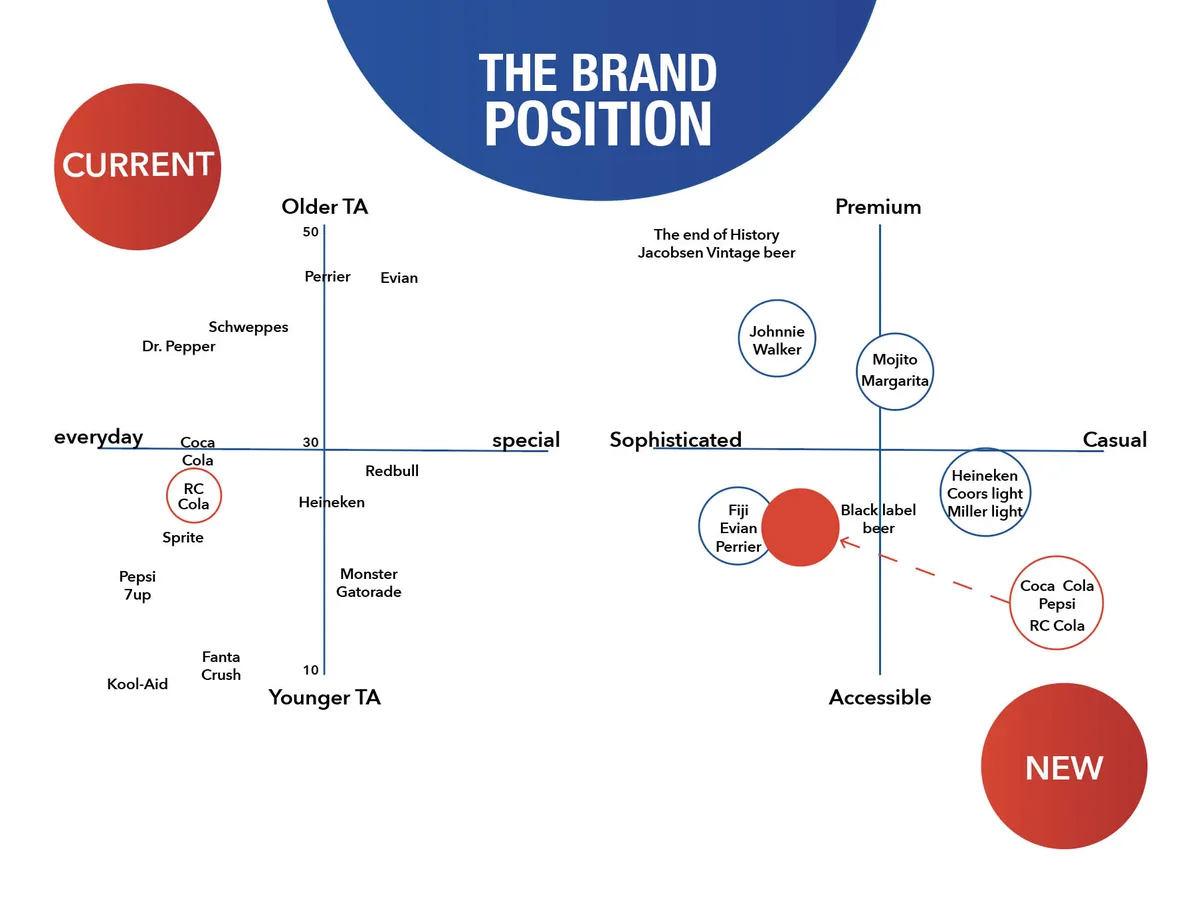
A Copy-Ready Positioning Map Template
You don’t need fancy software. Clear alignment with your positioning mapping builds confidence from the start. A spreadsheet works, and honestly, a whiteboard works better for early sessions because it encourages arguments. The structure below is worth keeping consistent so results are comparable over time.
| Field | What To Enter | Example Entry |
|---|---|---|
| Decision question | The one call this map informs | Should we enter the mid-market tier? |
| Axis one | Functional attribute with real trade-offs | Setup effort (low to high) |
| Axis two | Second attribute, ideally emotional or strategic | Depth of control (shallow to deep) |
| Players plotted | Five to eight competitors plus your brand | Six brands total |
| Current position | Where the market places you today | Mid setup, mid depth |
| Target position | Where strategy wants you to sit | Low setup, deep control |
| Evidence notes | Source for each placement | Twelve win-loss interviews |
| Action list | Three to five resulting moves | Rewrite onboarding copy; adjust tier pricing |
Fill in the evidence column honestly. If a competitor’s placement comes from a hunch, write “hunch.” Later, when someone challenges the strategy, you’ll know exactly which dots are sturdy and which need research before they can carry weight.
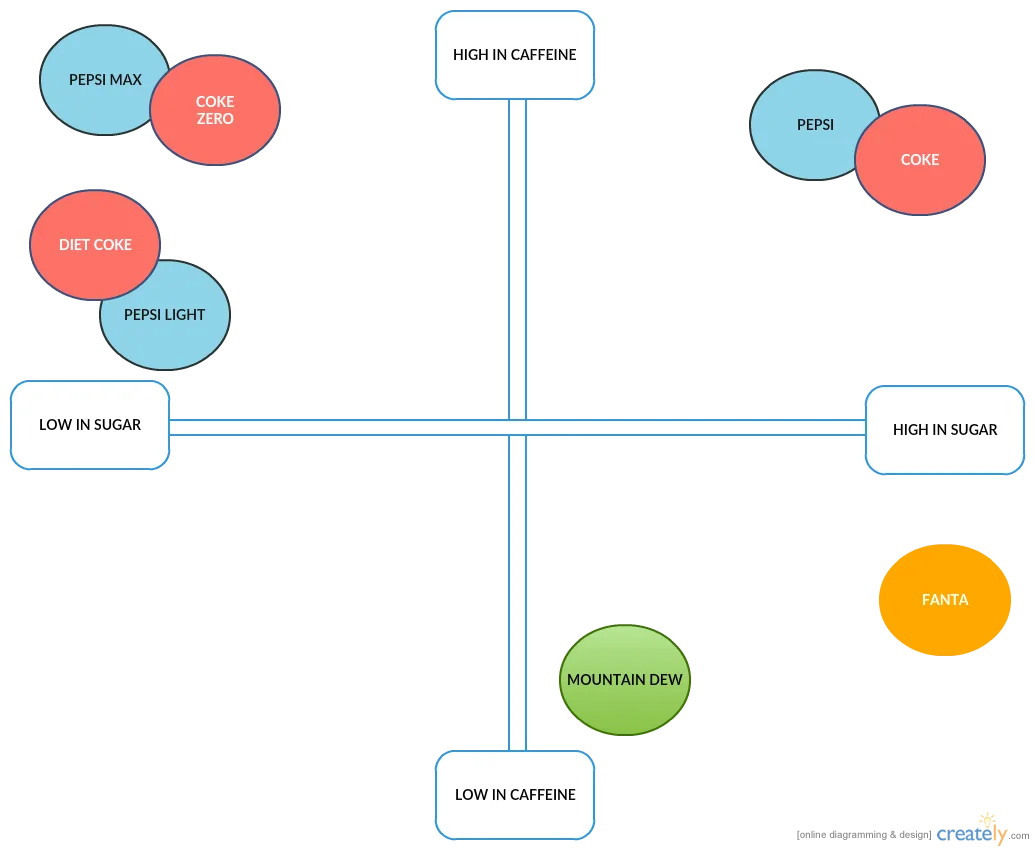
Common Mistakes That Wreck a Positioning Map
Most failures are predictable, which means they’re avoidable. Position not being mapped is a subtle one; the real trouble starts with axes chosen for convenience rather than customer relevance. This single mistake makes positioning mapping feel like busywork, because the chart reflects internal wishful thinking instead of market reality.
Another frequent foul is plotting too many competitors. Integrating positioning mapping into your workflow produces consistent quality. Beyond eight points the map becomes a cloud, and clusters stop being legible. Also watch for silent axis changes mid-session: someone redefines “premium” halfway through, and suddenly the dots mean different things.
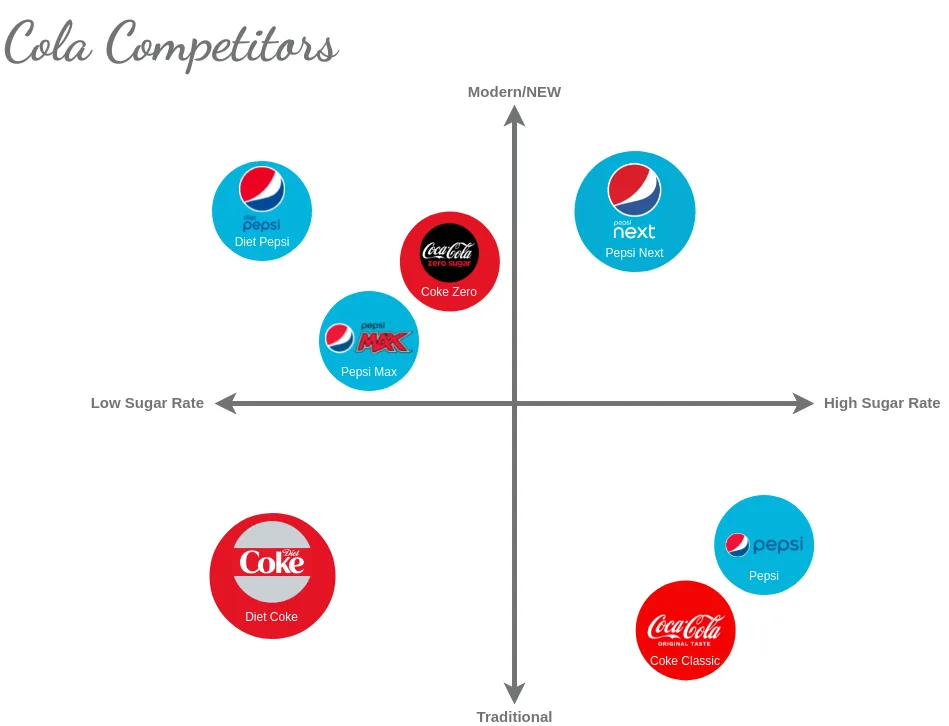
The sneakiest error is confusing current and desired position. If the map only shows aspiration, it’s a wish list. If it only shows reality, it’s a report. You need both, plus a plan for the distance between them.
Mistake: Treating One Map as Permanent
Markets move. A competitor relaunches, a new regulation shifts criteria, a generational preference rewrites what “quality” means. Positioning mapping published once and never revisited slowly turns into fiction, and decisions built on fiction get expensive.
The fix is cadence rather than complexity. Targeted refinements to your positioning mapping streamline the entire review. A quarterly refresh with fresh interview data keeps the map honest without much overhead. Even a single-page update beats a stale masterpiece.
How to Validate a Target Position Before Committing
Choosing a new position is a hypothesis, and hypotheses deserve testing. The cheapest validation is conversation: talk to prospects who currently choose a competitor and ask what would have to be true for them to switch. Their answers either support the gap or quietly dismantle it.
After qualitative signals, run a small quantitative check. A quick survey presenting your current and proposed positioning statements to a sample of buyers will show which direction generates more interest. Positioning mapping gets much more persuasive when a chart is backed by even modest numbers.
Watch for one red flag: if the only people excited about the new position are internal stakeholders, stop. Customer enthusiasm is the signal that matters. The map is a tool for finding the position; customers decide whether it lives.
Bringing Positioning Mapping Into Your Team Rhythm
Sustainable use beats heroic effort. Slot positioning mapping into planning cycles rather than treating it as a special project. A simple ritual works: refresh the data every quarter, present the updated map alongside revenue and win-rate trends, then tie one or two commitments to the target position.
Over time, this turns positioning from an abstract debate into something measurable. You’ll see whether the market’s perception of your brand is drifting toward the target, and you’ll catch competitor moves early because someone is watching the grid.
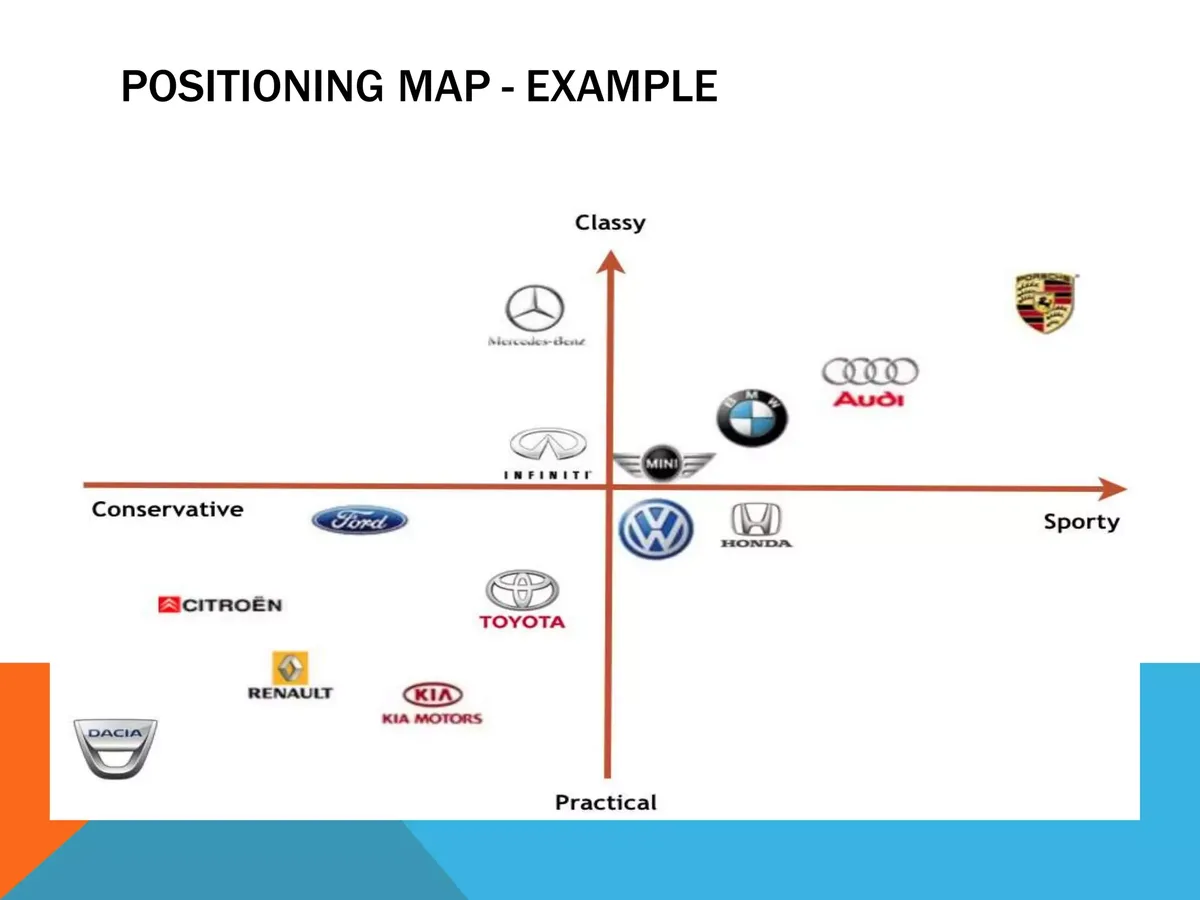
Teams that stick with this pattern often report the same experience: the map stops being a marketing artifact and becomes a shared language. Pricing discussions, hiring decisions, and feature debates all reference the same grid. That coherence alone justifies the effort, long before any single chart delivers a breakthrough insight.
The takeaway is straightforward. Positioning mapping works because it forces explicit choices about axes, evidence, and intention. Build it carefully, question it honestly, and update it regularly — and it will keep steering strategy in the right direction even as the market shifts beneath your feet.
Frequently Asked Questions About Positioning Mapping
Here is an in-depth breakdown of key considerations regarding Frequently Asked Questions About Positioning Mapping:
How Many Competitors Should Appear on a Positioning Map?
Five to eight is the sweet spot. Include your direct rivals plus one adjacent player who could plausibly enter your space. Fewer than five can make a crowded market look deceptively open, and more than eight turns the grid into visual noise that hides the useful patterns.
Can I Use Positioning Mapping Without Customer Research?
You can start with internal hypotheses, but label them clearly. A map built entirely on assumptions is fine for a rapid workshop, not for pricing or product decisions. Even a handful of customer conversations will reveal where your guesses were off, and those surprises are usually the most valuable part of the exercise.
What’s the Difference Between Current and Desired Position?
Current position is where buyers place you today, based on their perceptions. Desired position is where strategy says you should sit. Positioning mapping is most useful when both appear on the same chart, because the distance between them tells you how much work repositioning will actually require.
How Often Should a Positioning Map be Refreshed?
Quarterly is a practical rhythm for most companies. Fast-moving categories might warrant more frequent checks. The aim isn’t perfect accuracy but early detection of competitive shifts, so the map never drifts far enough from reality to mislead a real decision.
Do Positioning Mapping Exercises Work for Small Businesses?
Absolutely, and often more dramatically than for large firms. Small businesses can move fast, which means a gap identified on the map can be tested within weeks. With a handful of customer interviews and a shared grid, even a modest team can spot a defensible corner the bigger players ignore.
For verified reference and background research, consult the authoritative informational resource on this topic.